
How to insert a chart
Choose Insert › Insert chart, paste data or load a .csv file (or pick an example), choose the chart type and columns, and press Insert chart.
Steps
Choose Main menu › Insert › Insert chart.
Paste from a spreadsheet, type values separated by commas or tabs, or Load file for a .csv. The first row names the columns. Or pick an example: Calibration, Titration, Dose-response, Peak table or HPLC trace.
Pick the Chart type: Scatter, Line, Linear fit, Titration, Dose-response or Chromatogram.
Pick the X column and Y columns, and give the axis titles. Units go in parentheses; type
^(-1)for a superscript and_(2)for a subscript, as inmol L^(-1).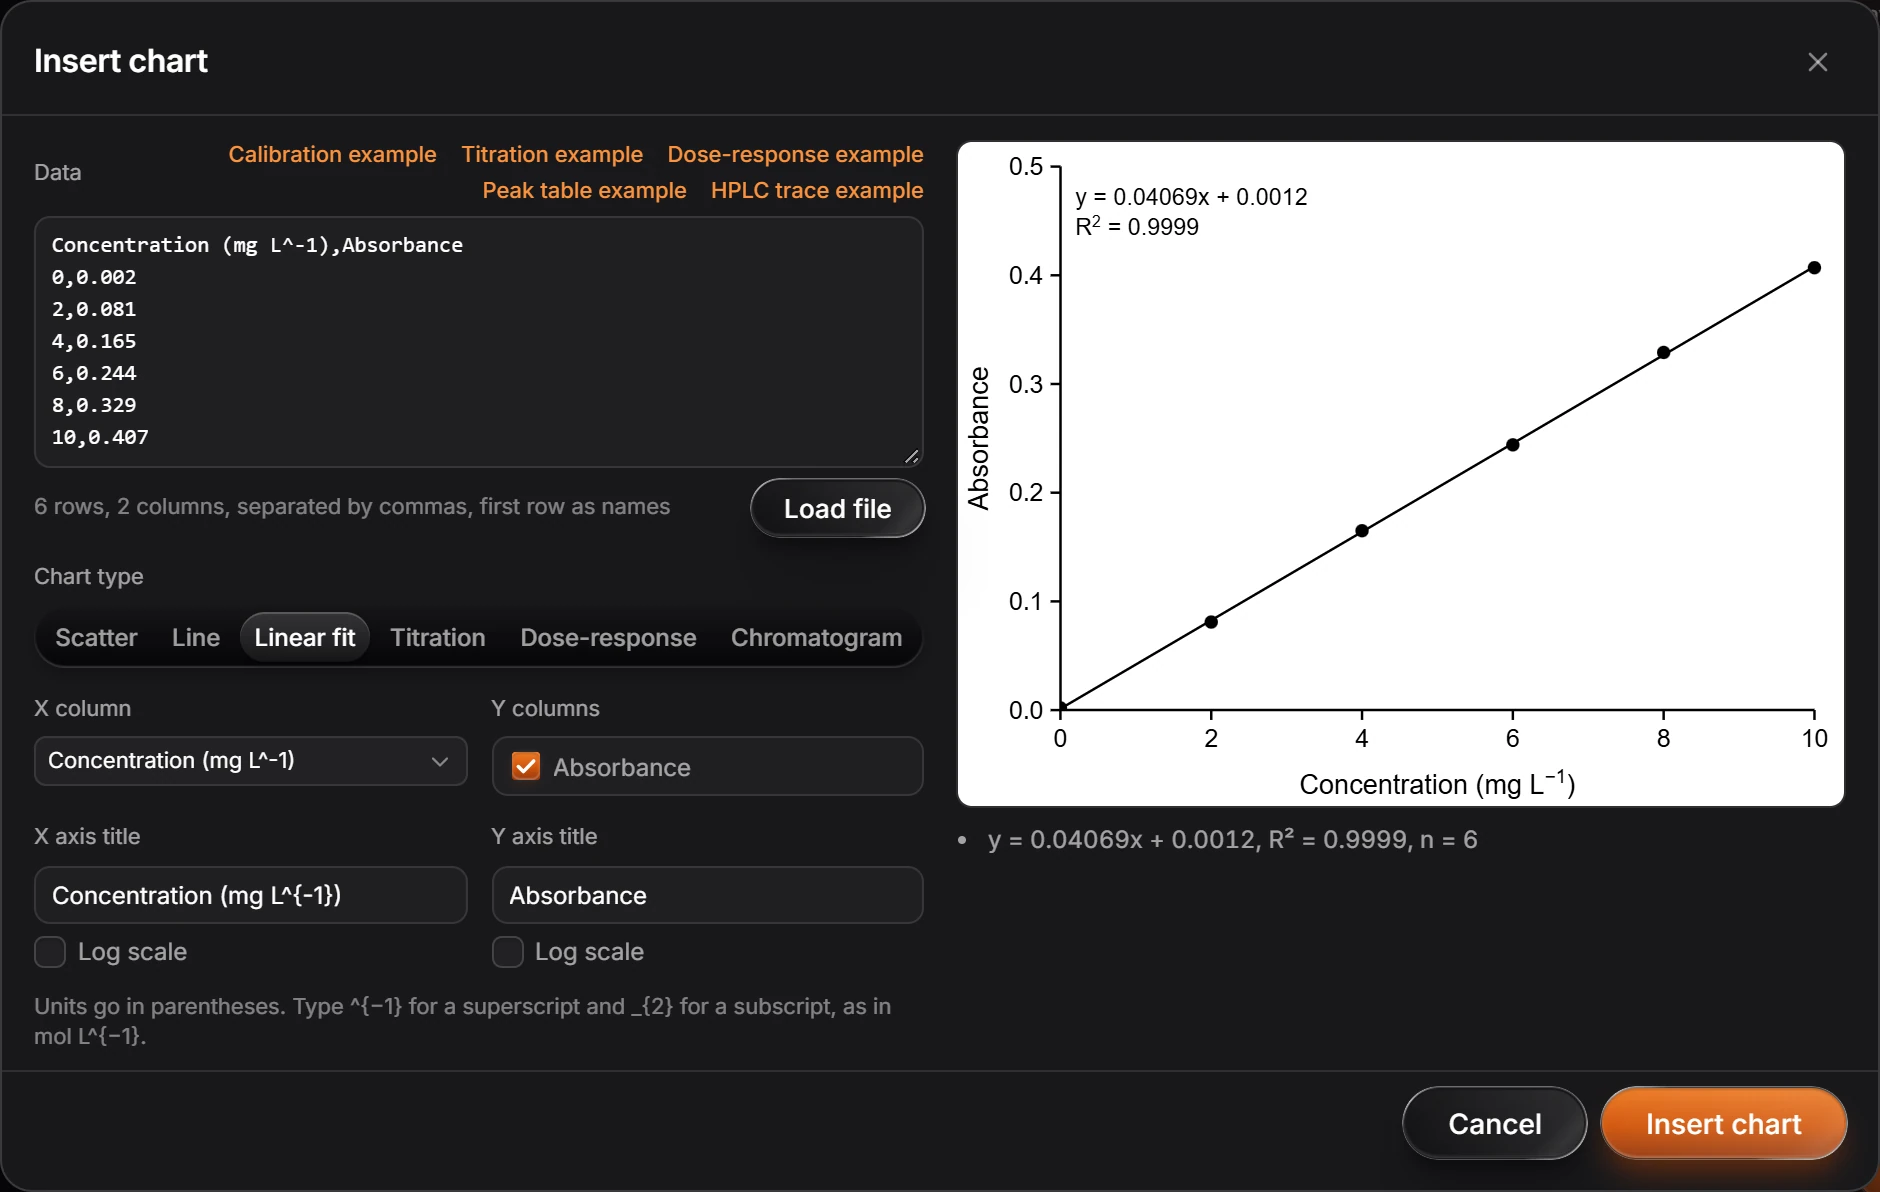
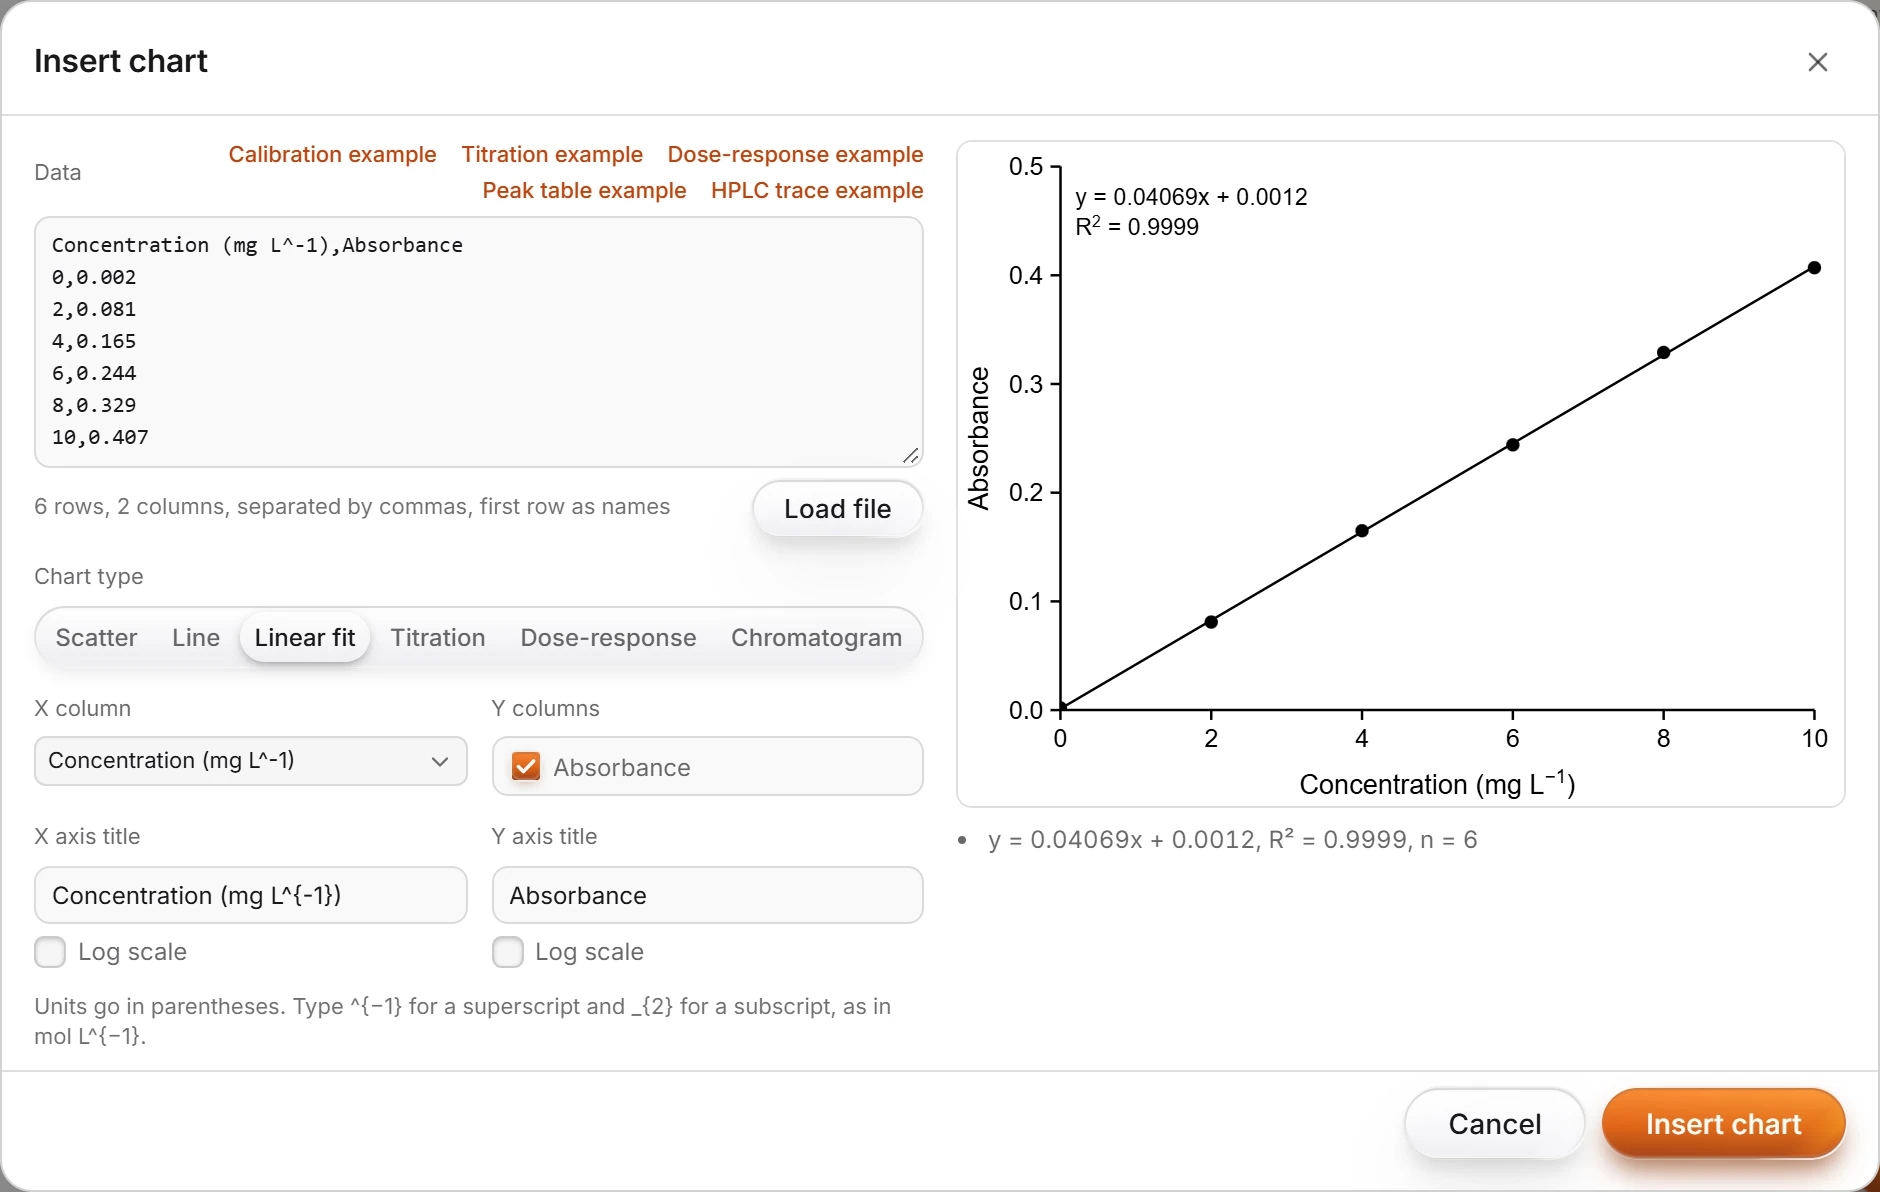
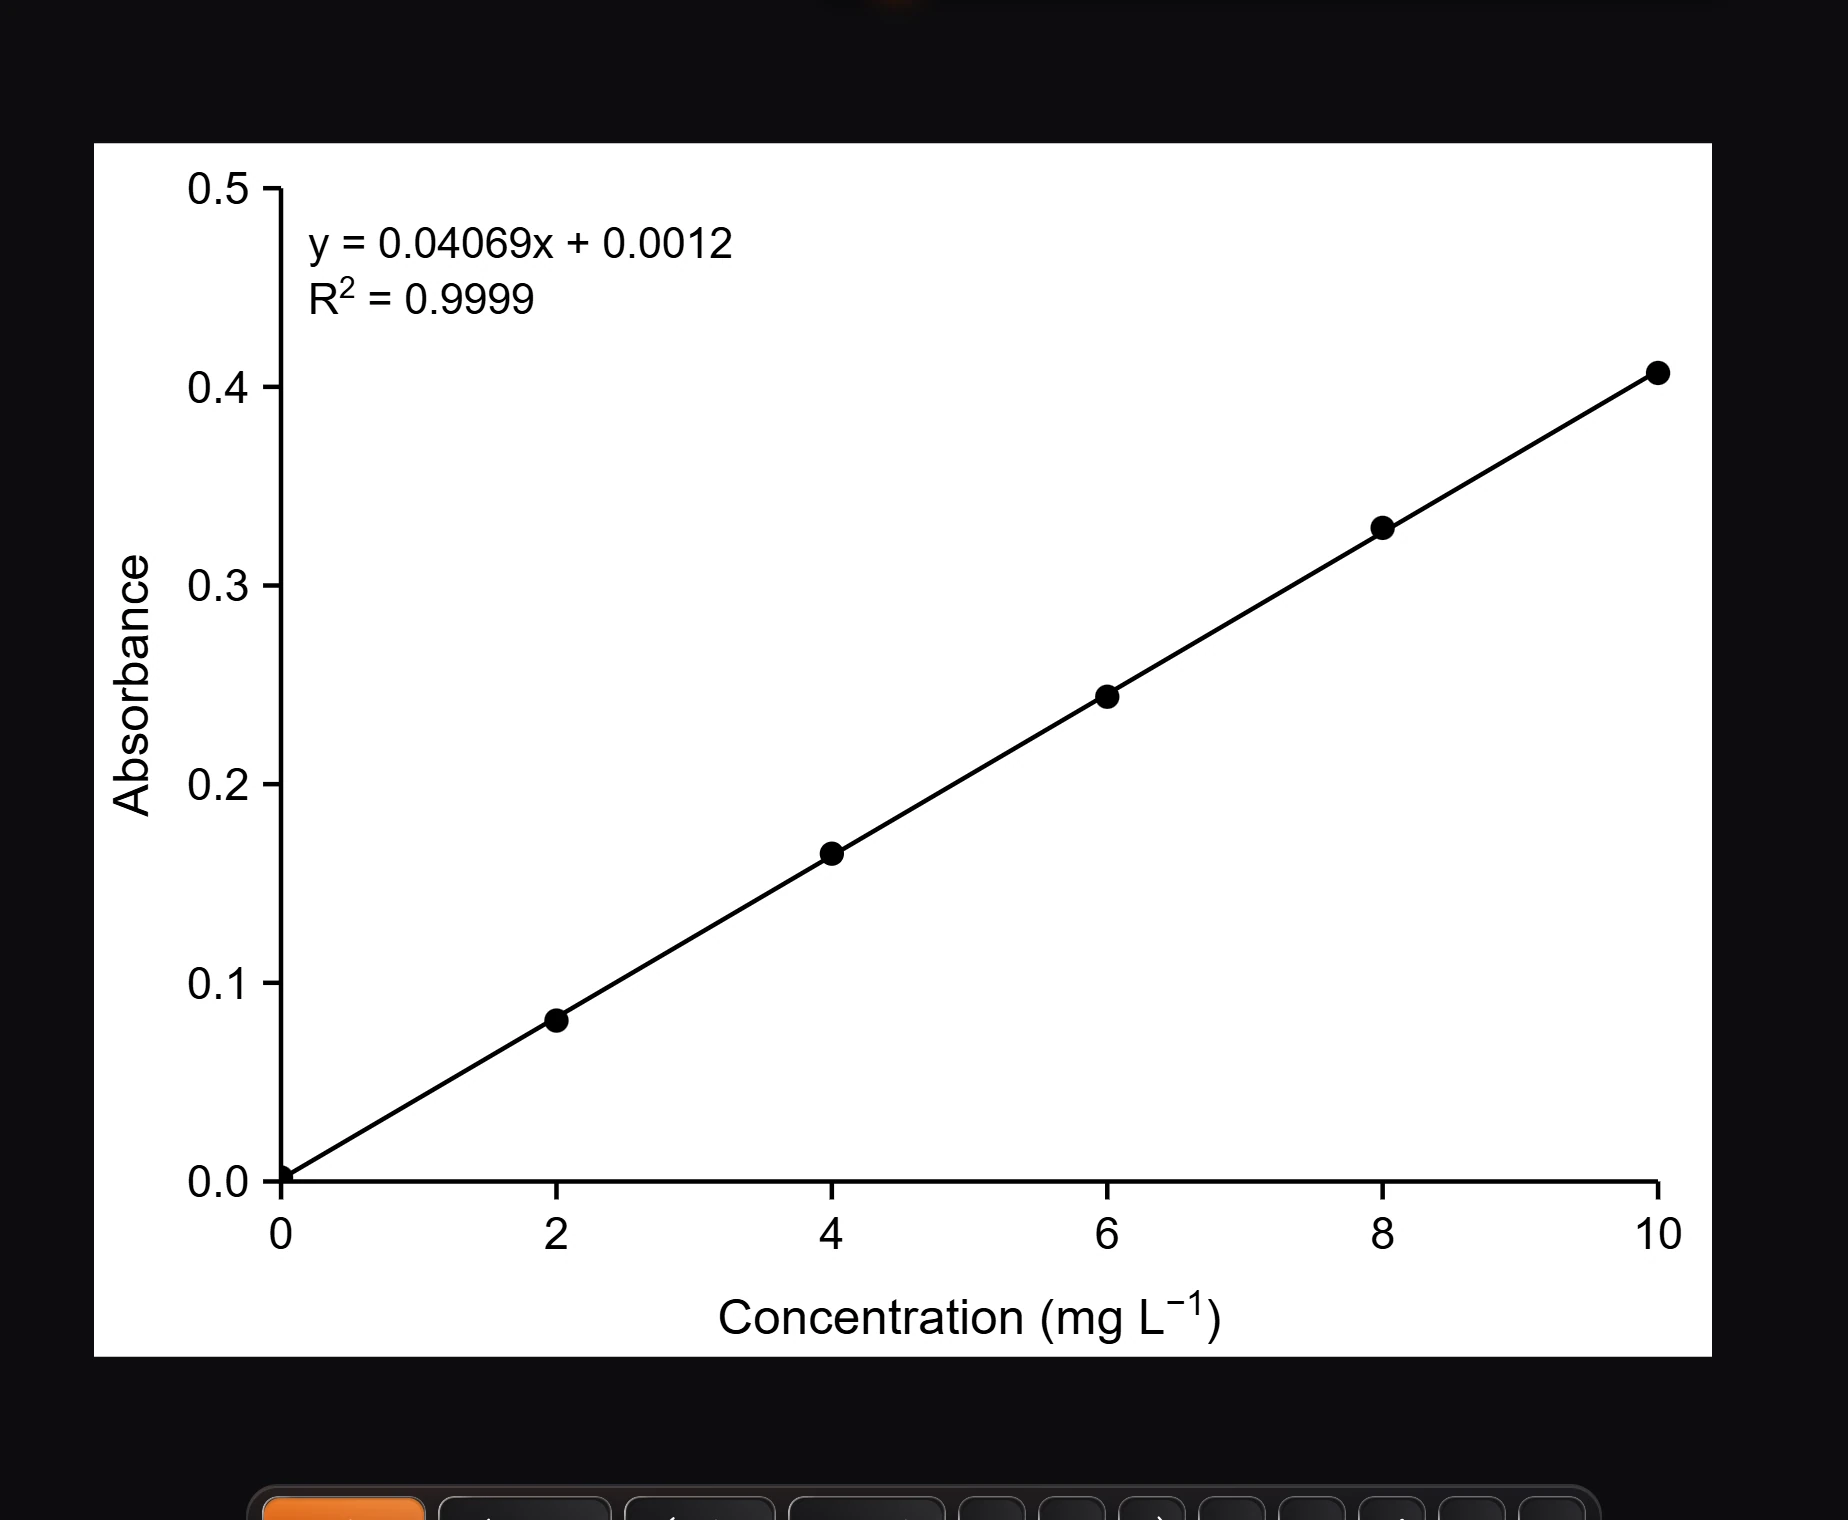
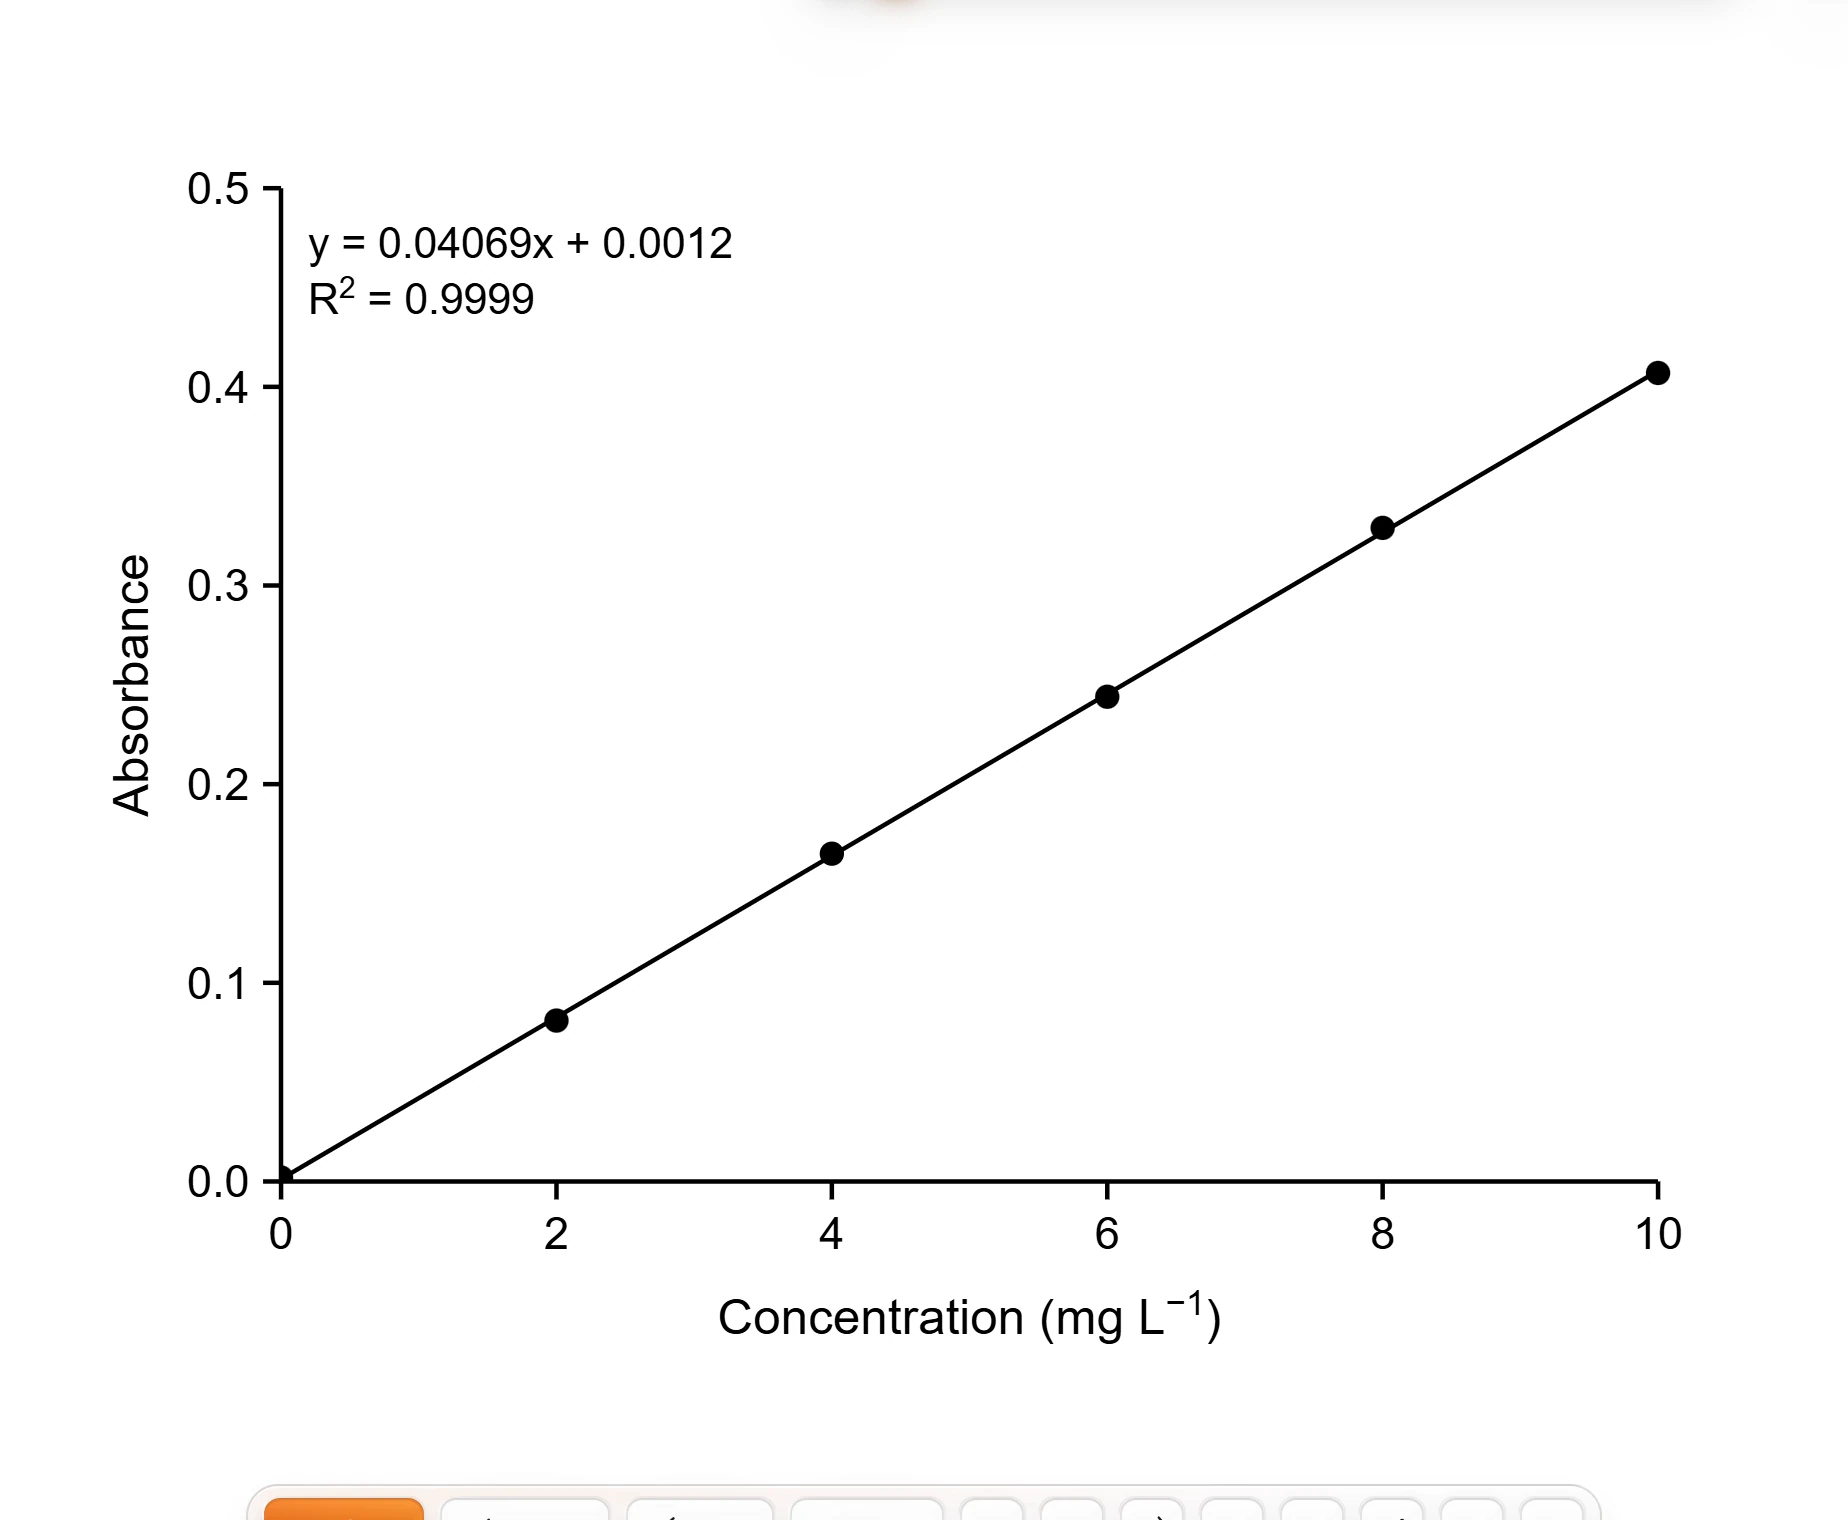
Press Insert chart.
Is this helpful?
Last updated Nov 12, 2026
- Still stuck? Read the FAQ or contact support.
- Something wrong on this page? Tell us.
- For AI tools: llms.txt