
NMR and spectra
Predicted 1H and 13C NMR with journal text, imported spectra, peak picking and integration, and comparing a measured spectrum with the prediction.
Start here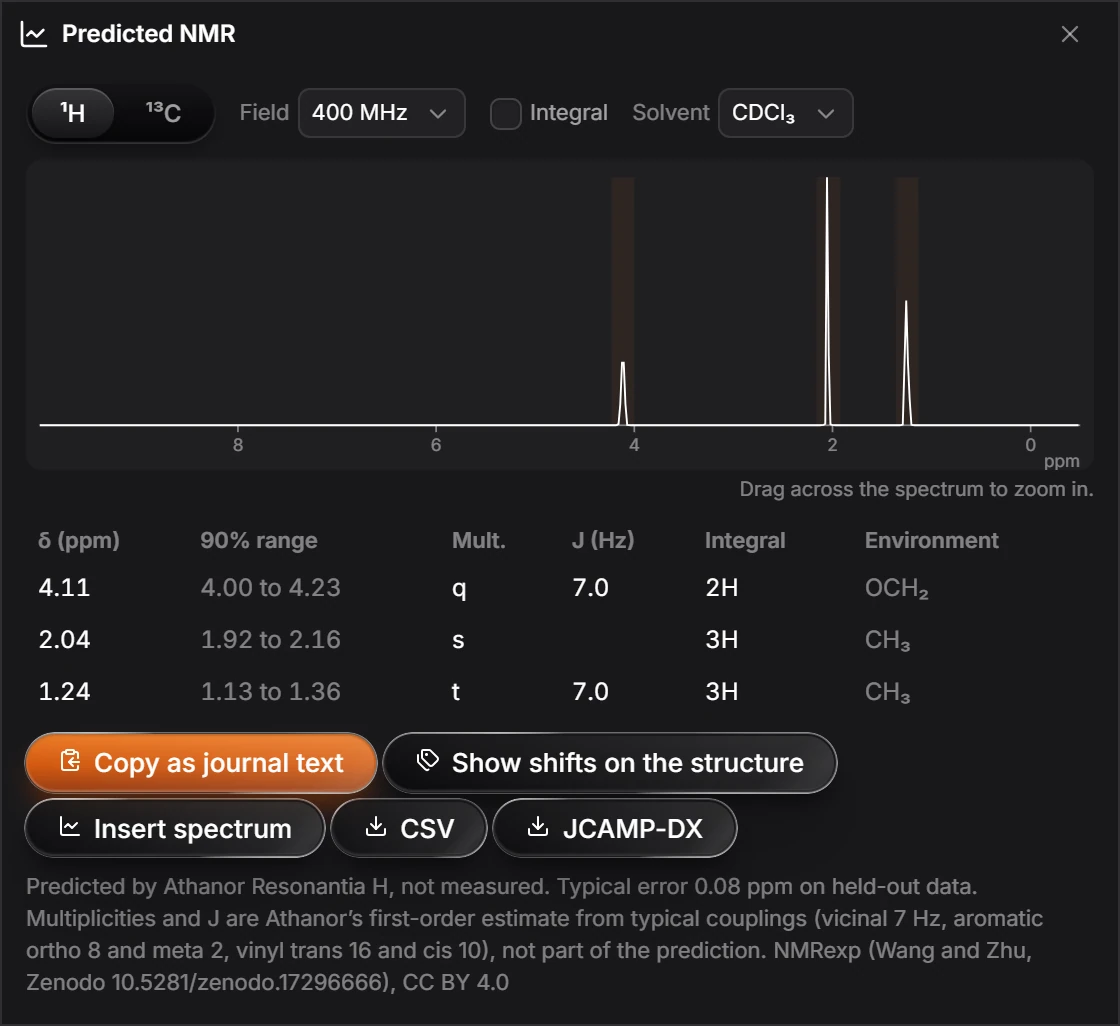
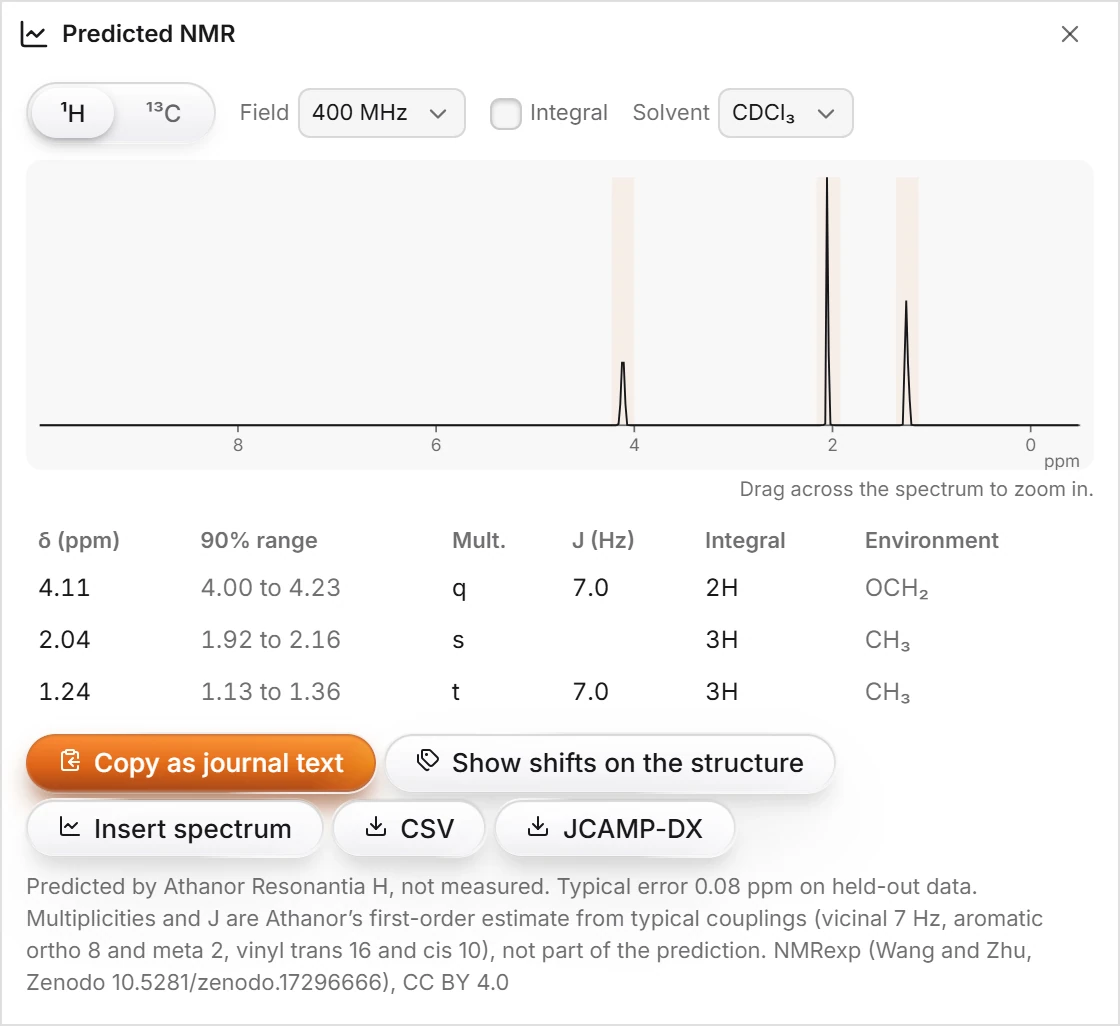 1 · How-toHow to predict a 1H NMR spectrumSelect the structure and choose Object › Chemistry › Predict 1H NMR. The Predicted NMR window shows the spectrum and a table of shifts, each with its 90% range, multiplicity, coupling constant, integral and environment.
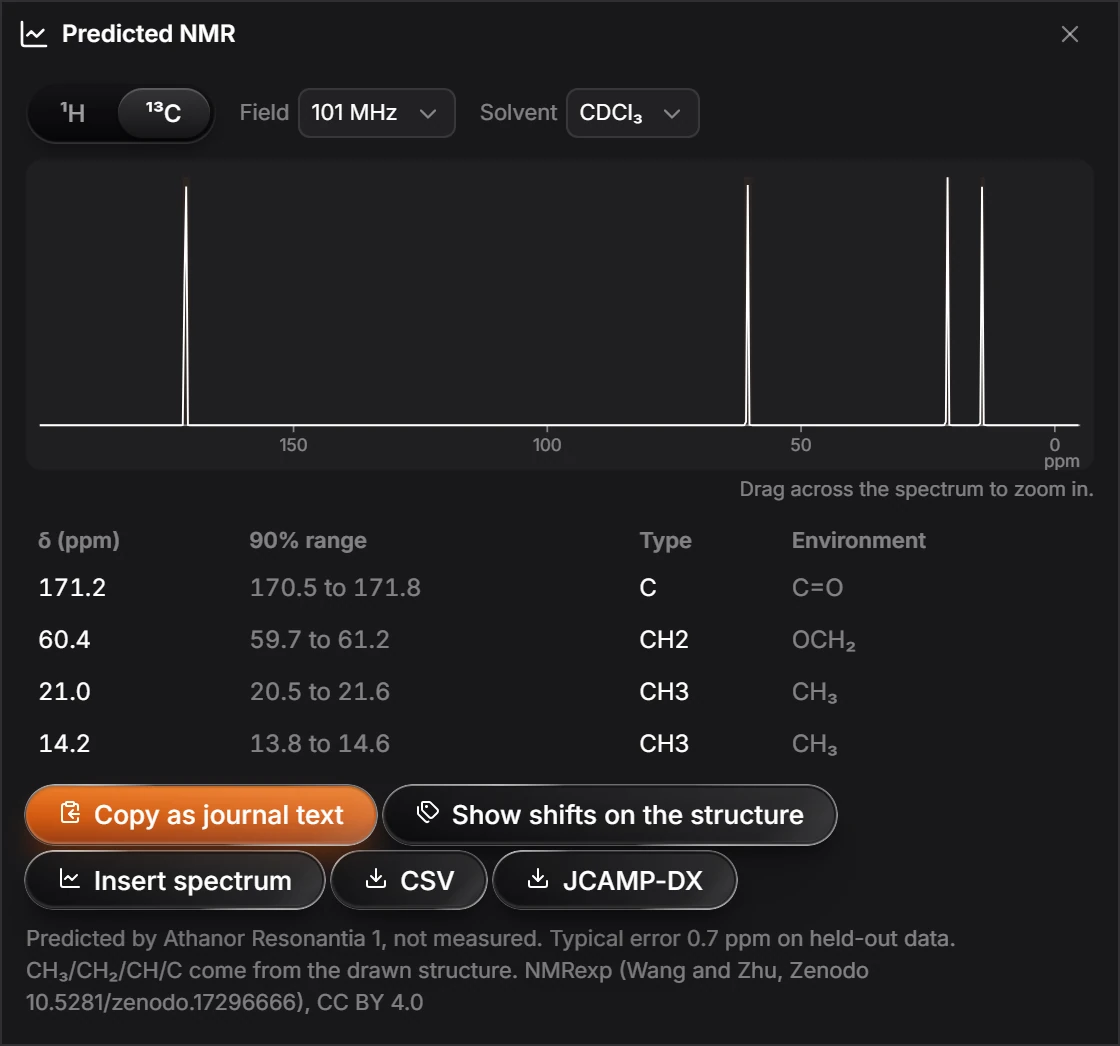
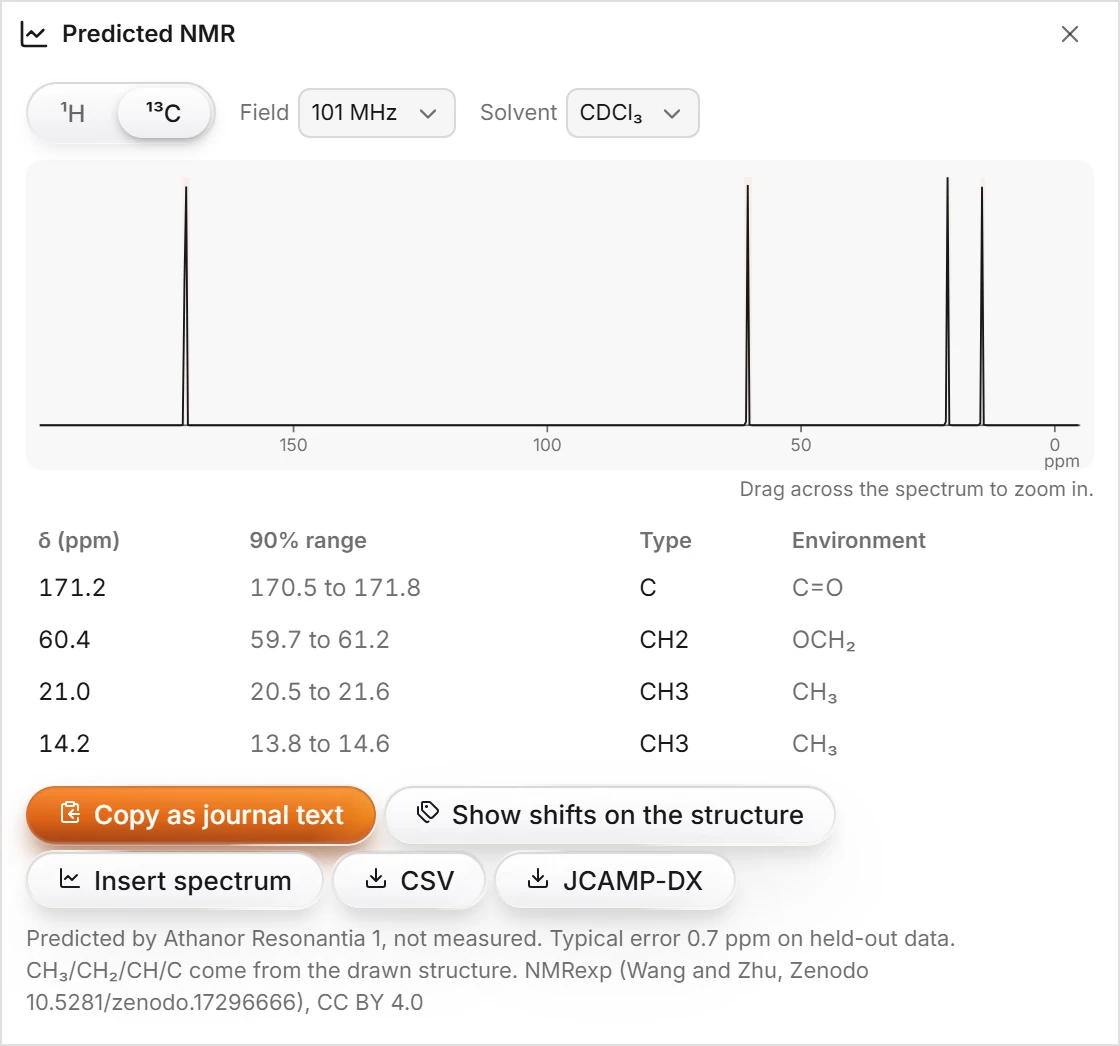 2 · How-toHow to predict a 13C NMR spectrumSelect the structure and choose Object › Chemistry › Predict 13C NMR, or switch the Predicted NMR window to its 13C tab. Each carbon gets a predicted shift, a 90% range, its type (CH3, CH2, CH or C) and its environment.
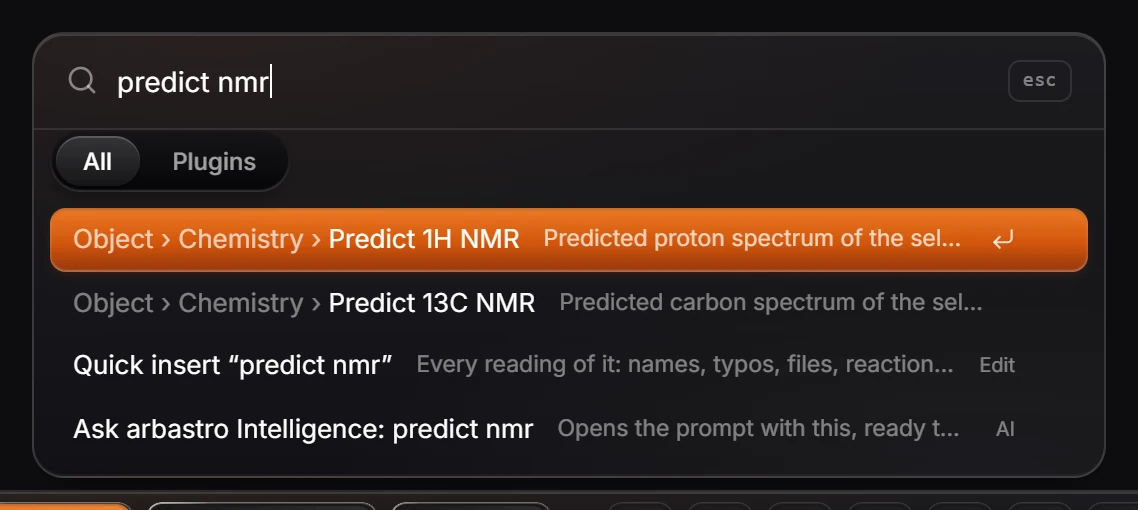
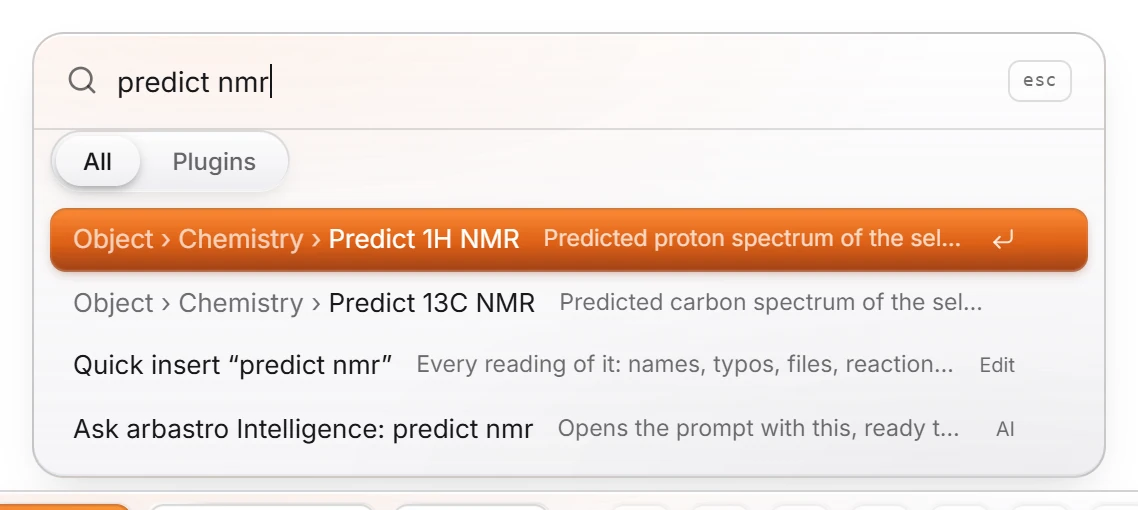 3 · ReferenceThe NMR windowThe Predicted NMR window opens from Object › Chemistry › Predict 1H NMR or Predict 13C NMR. It has 1H and 13C tabs, a Field and Solvent choice, an Integral switch, a spectrum you can zoom by dragging, the table of signals, and buttons to copy, label, insert or save.

 4 · How-toHow to copy NMR data as journal textIn the Predicted NMR window, press Copy as journal text. The data is copied as one line in journal style, for example "¹H NMR (400 MHz, CDCl3, predicted) δ 4.11 (q, J = 7.0 Hz, 2H), ...". Paste it with Ctrl+V.
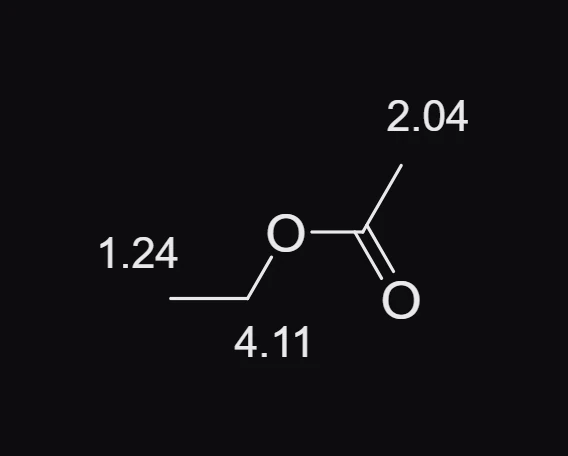
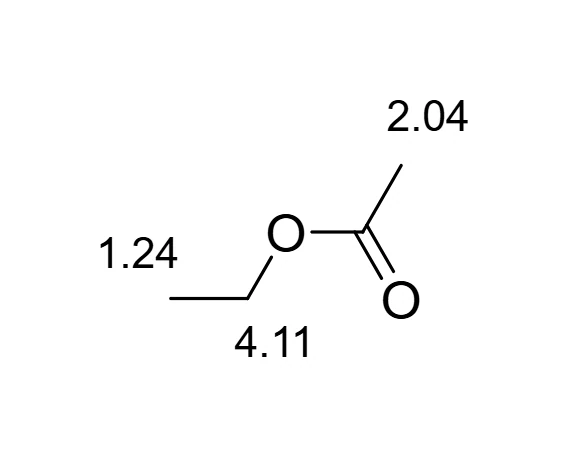 5 · How-toHow to label a structure with its chemical shiftsIn the Predicted NMR window, press Show shifts on the structure. Each predicted shift is written beside its atom as a label on the page. One Ctrl+Z removes them all.
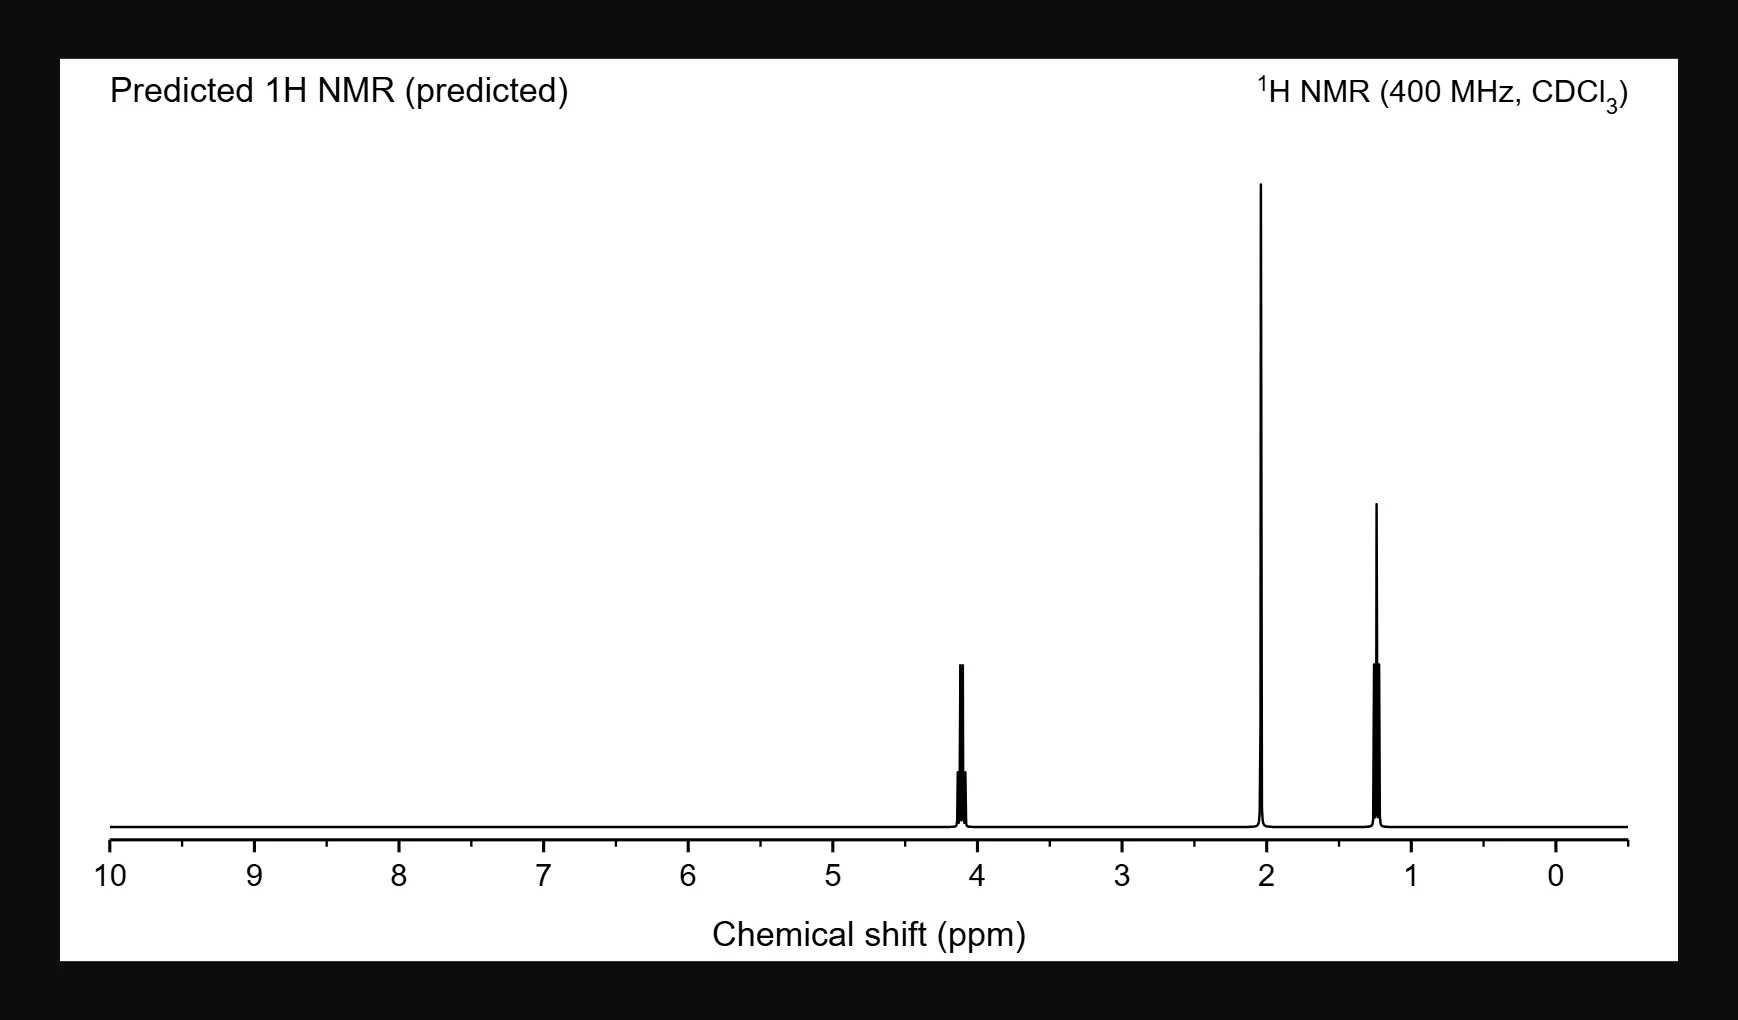
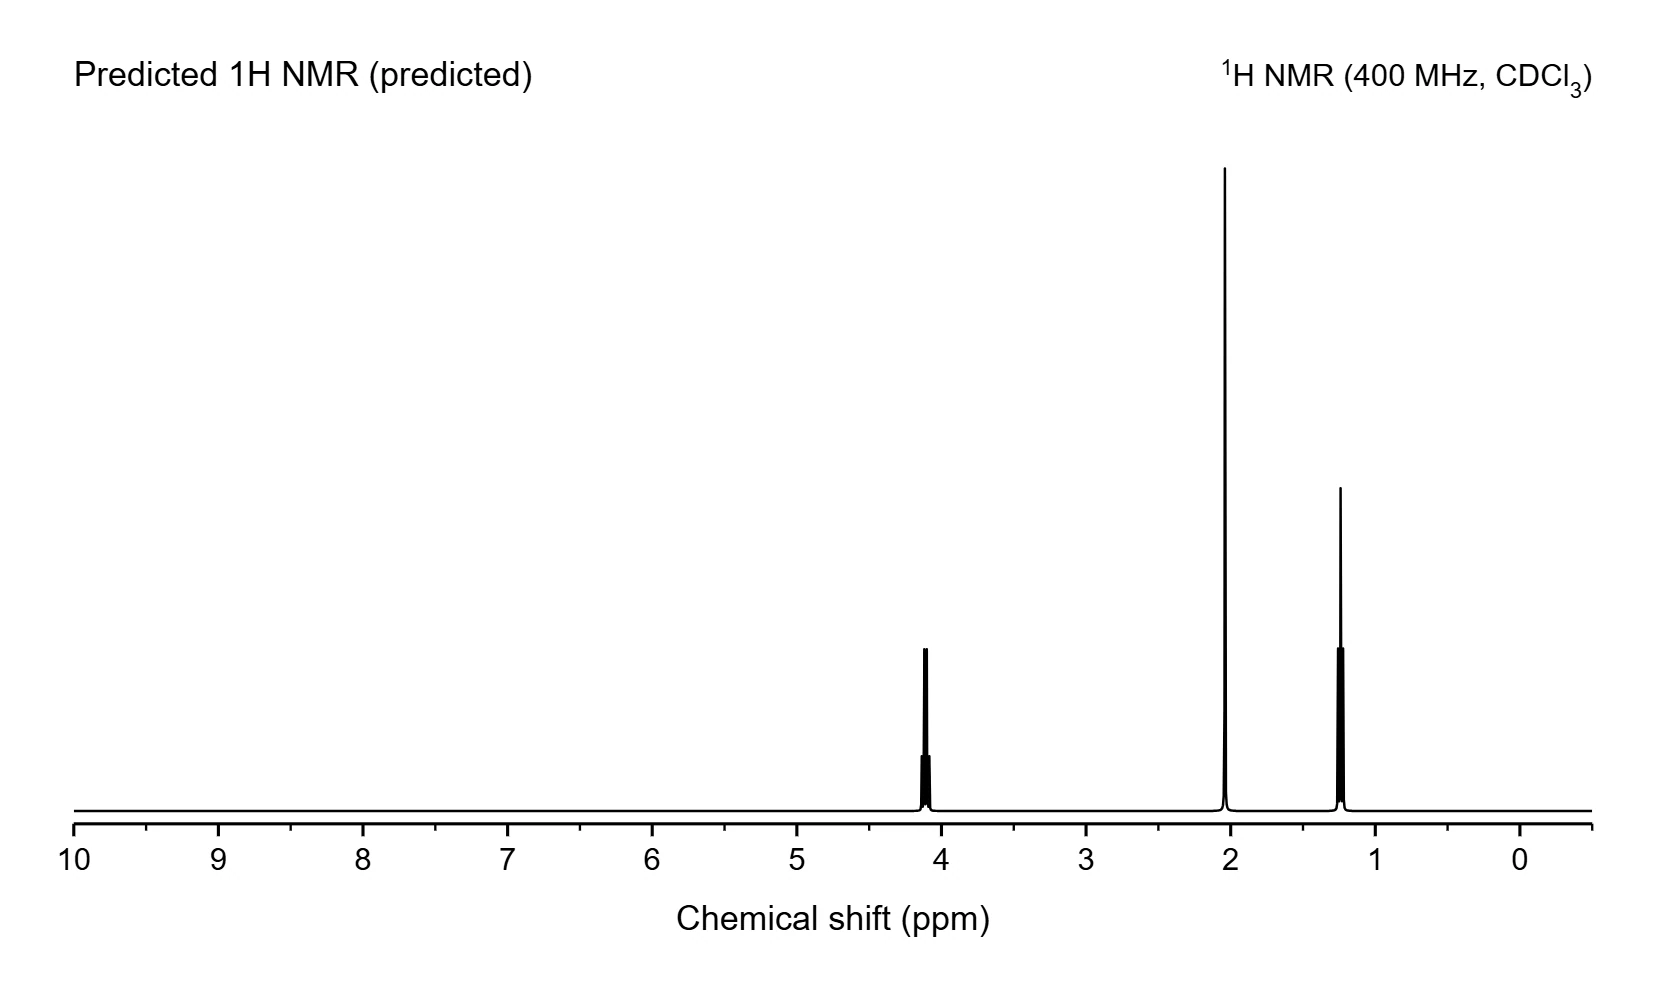 6 · How-toHow to put a predicted spectrum on the page and export itIn the Predicted NMR window, press Insert spectrum to place the spectrum on the page as a figure, then export it like any figure. CSV saves the table of signals, and JCAMP-DX saves the spectrum as a standard data file.
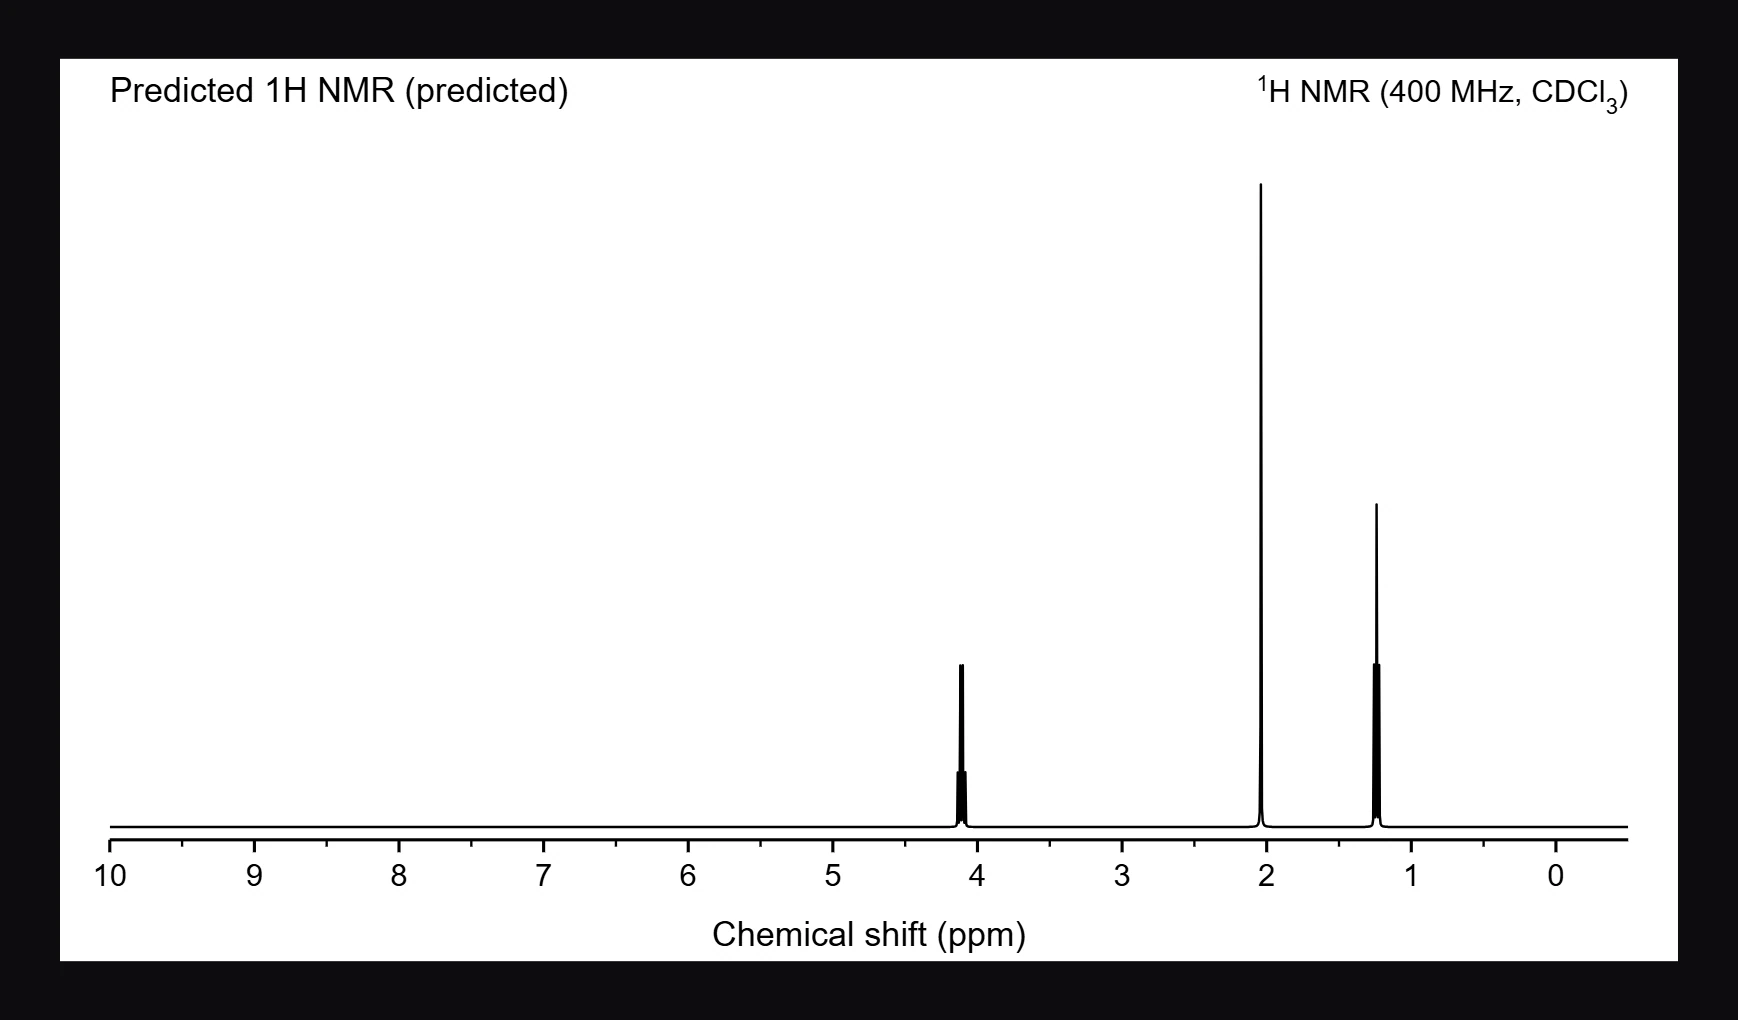
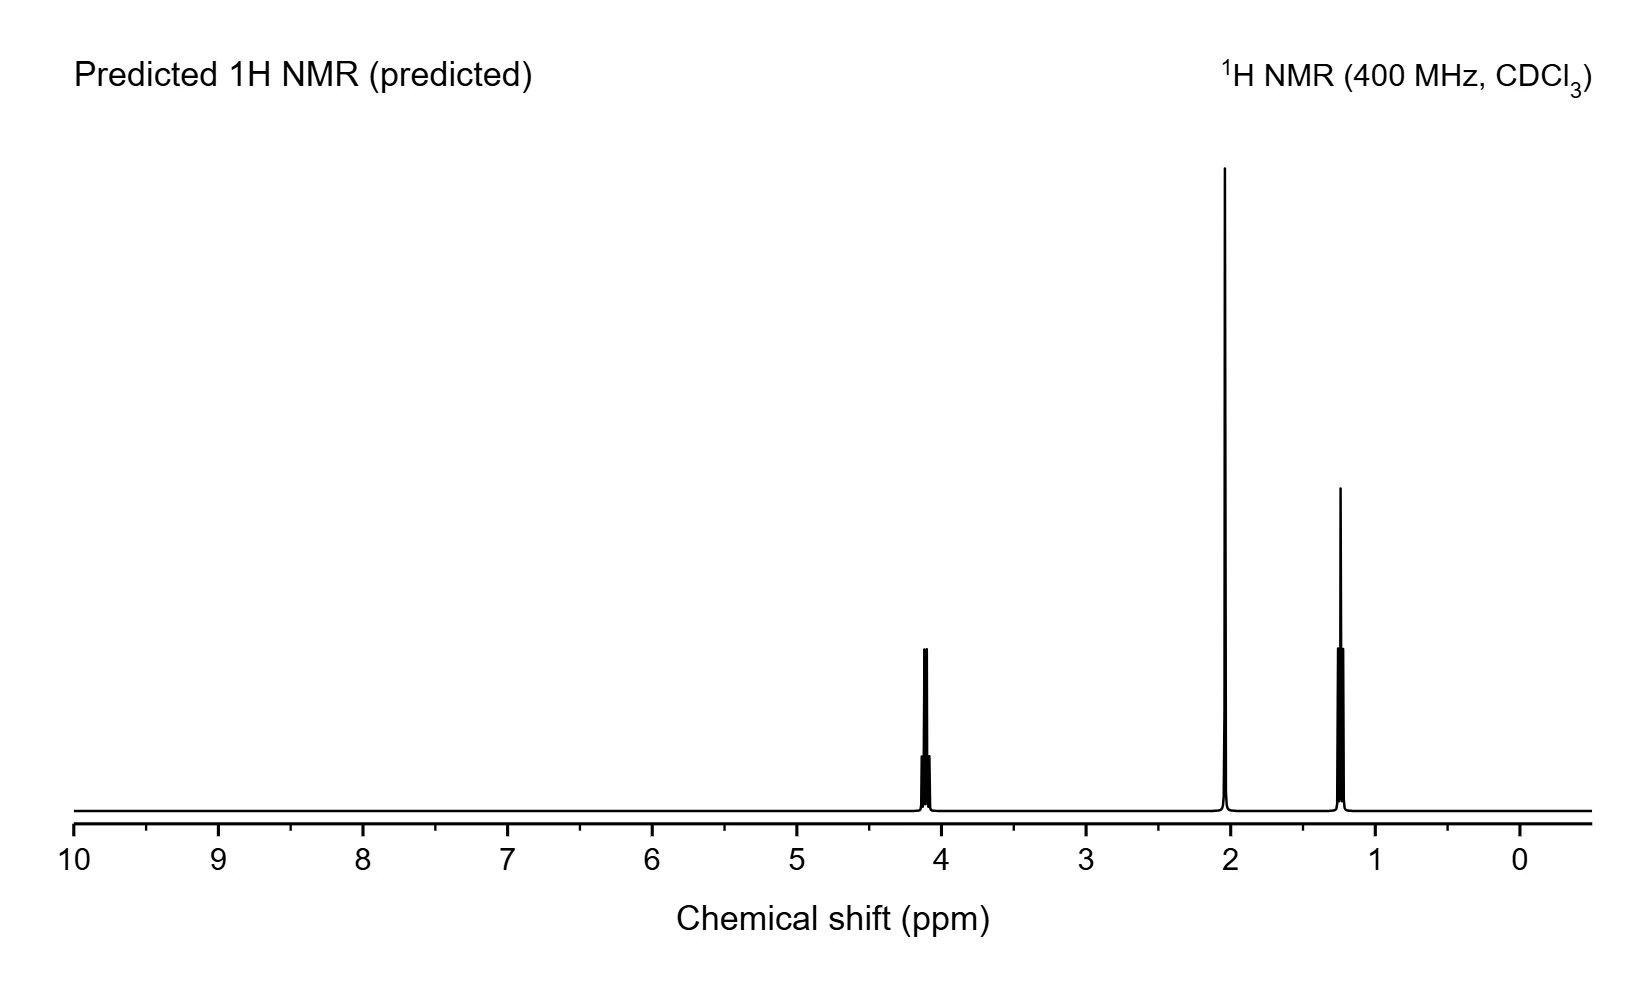 7 · How-toHow to import an NMR, IR or mass spectrumChoose Insert › Import spectrum and pick a JCAMP-DX file or a zipped Bruker dataset. The spectrum is placed on the page with its axis, ready for Analyze spectrum.
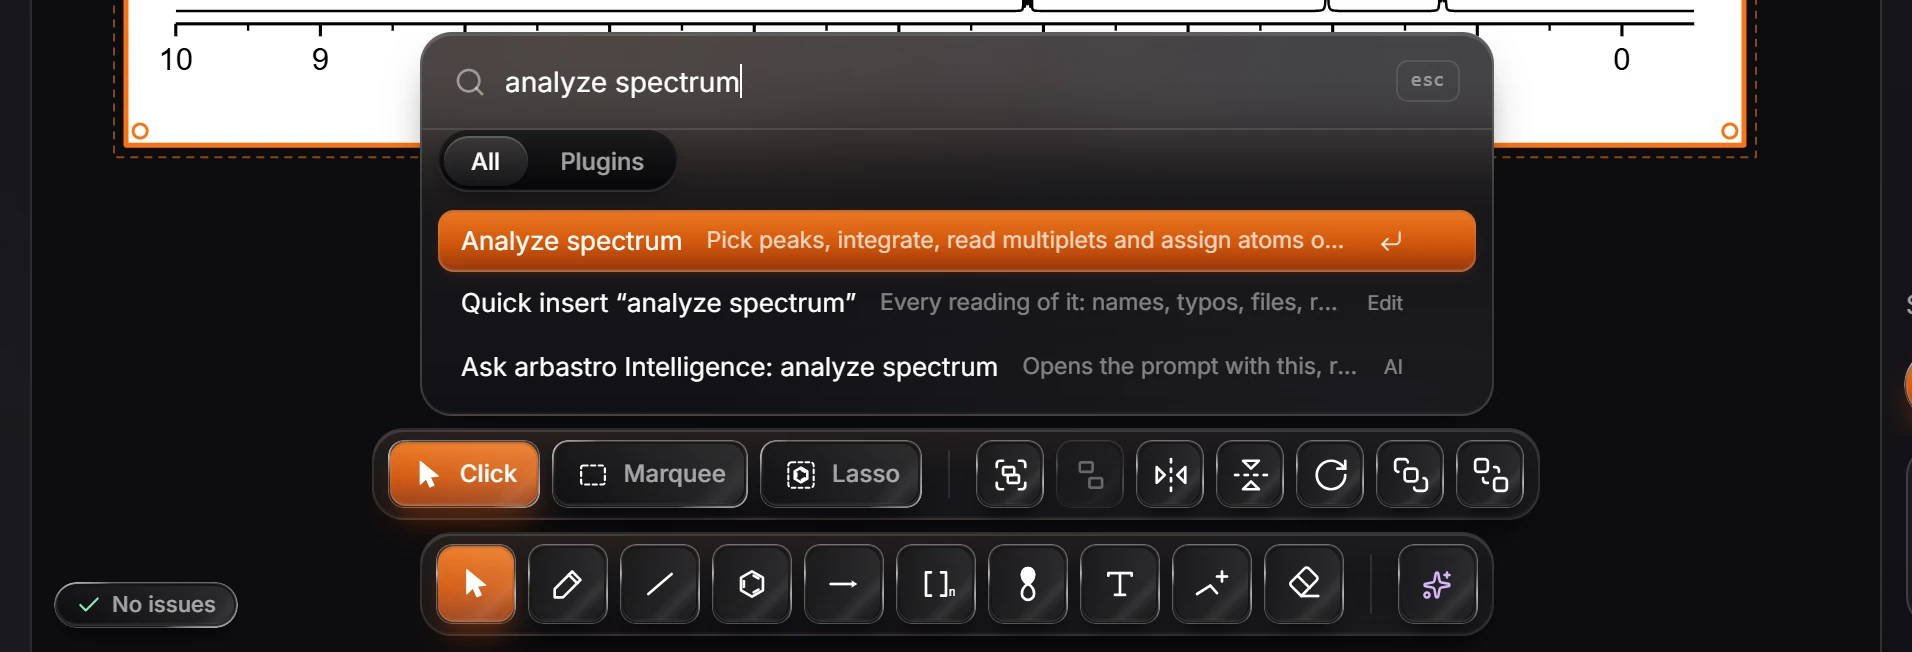
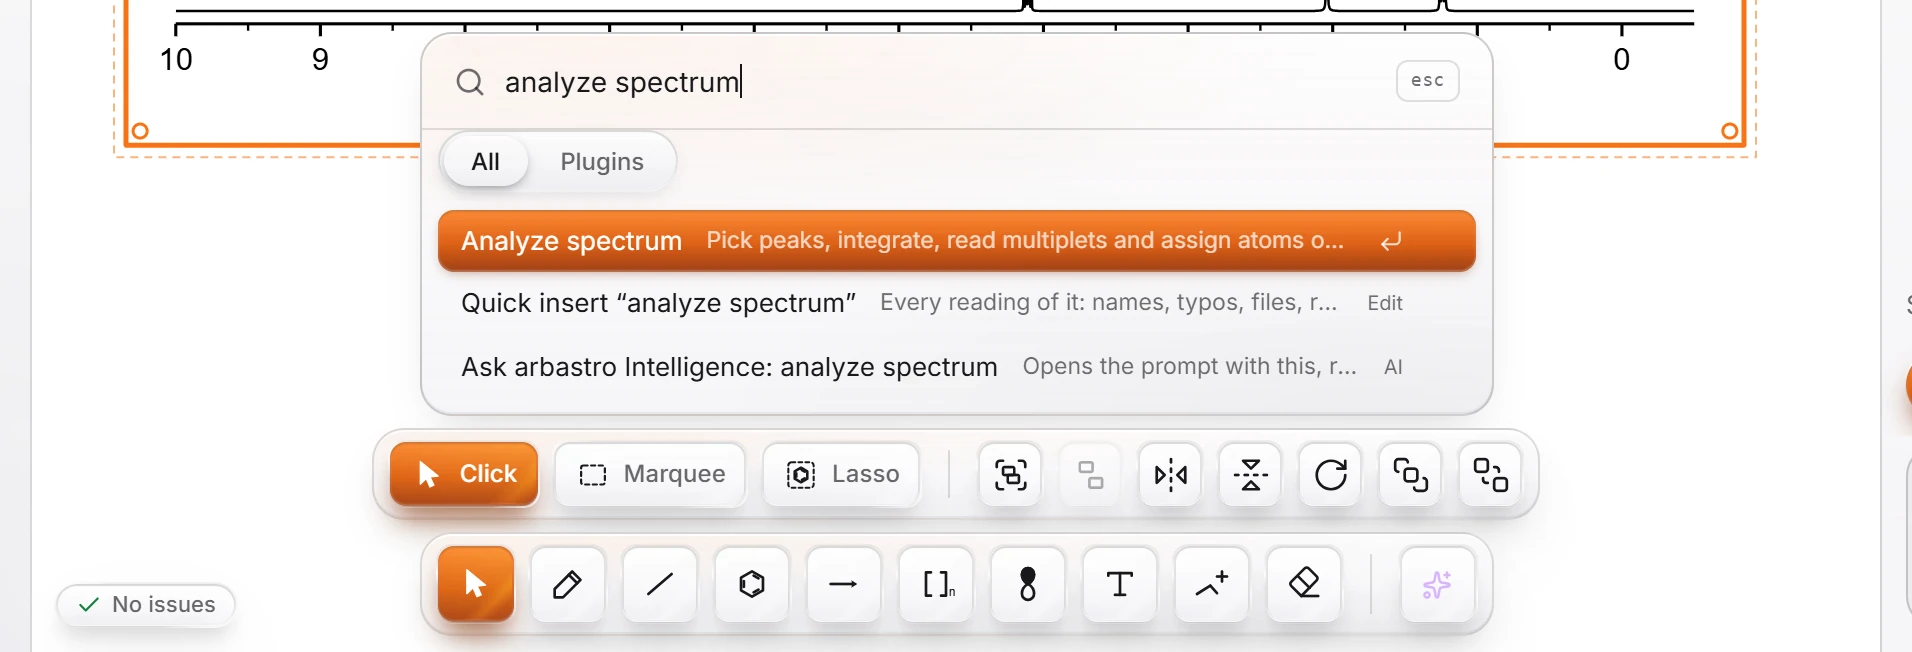 8 · How-toHow to pick peaks and integrate a spectrumSelect an imported spectrum and choose Analyze spectrum. Press Pick peaks and Integrate; the Peaks and Integrals tabs list the results, and the report line is ready to Copy or Add to page.
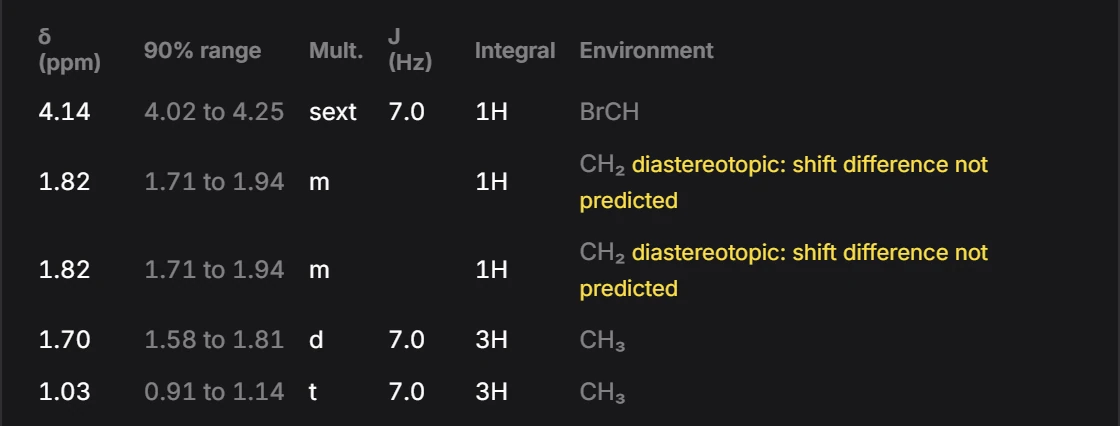
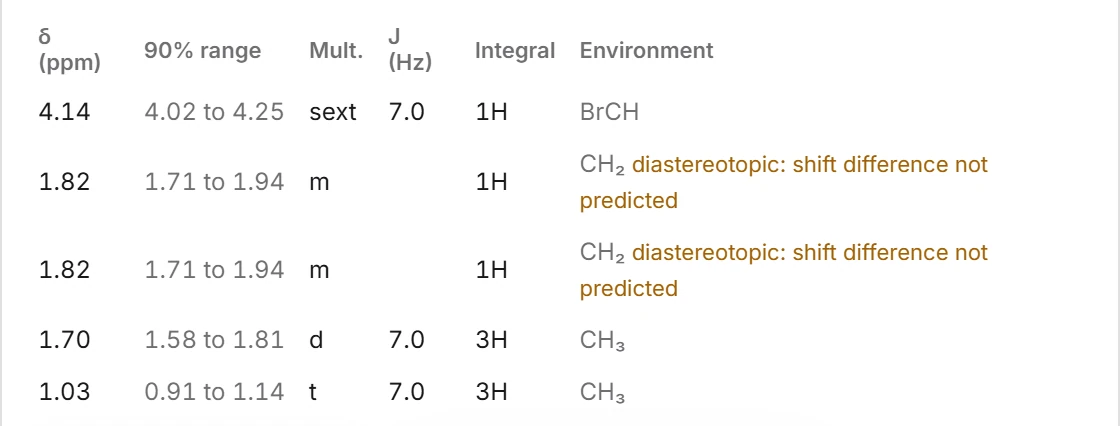 9 · ConceptDiastereotopic protons in a predicted spectrumWhen the two protons of a CH2 are diastereotopic, for example next to a stereocenter, the 1H table lists them as two 1H rows marked "diastereotopic: shift difference not predicted". Both get the same predicted shift.

 10 · ConceptHow accurate predicted NMR shifts areOn data the model never saw, predicted 1H shifts are typically within 0.08 ppm and 13C shifts within 0.7 ppm. Each shift comes with a 90% range. Multiplicities, J values and carbon types are worked out from the structure, not predicted.
- Still stuck? Read the FAQ or contact support.
- Something wrong on this page? Tell us.
- For AI tools: llms.txt