
How to predict a 1H NMR spectrum
Select the structure and choose Object › Chemistry › Predict 1H NMR. The Predicted NMR window shows the spectrum and a table of shifts, each with its 90% range, multiplicity, coupling constant, integral and environment.
Steps
Draw or insert the structure, for example ethyl acetate (press / and type
ethyl acetate).Select it with Select (V).
Choose Object › Chemistry › Predict 1H NMR in the Main menu, or press Ctrl+K and type
predict nmr.The Predicted NMR window opens on the ¹H tab. The spectrum is drawn at the top and the table below lists each signal:
Column What it says δ (ppm) The predicted chemical shift 90% range Where the true shift falls 90% of the time Mult. The splitting: s, d, t, q and so on J (Hz) The coupling constant Integral How many protons the signal stands for Environment Which group the protons belong to, such as OCH₂ 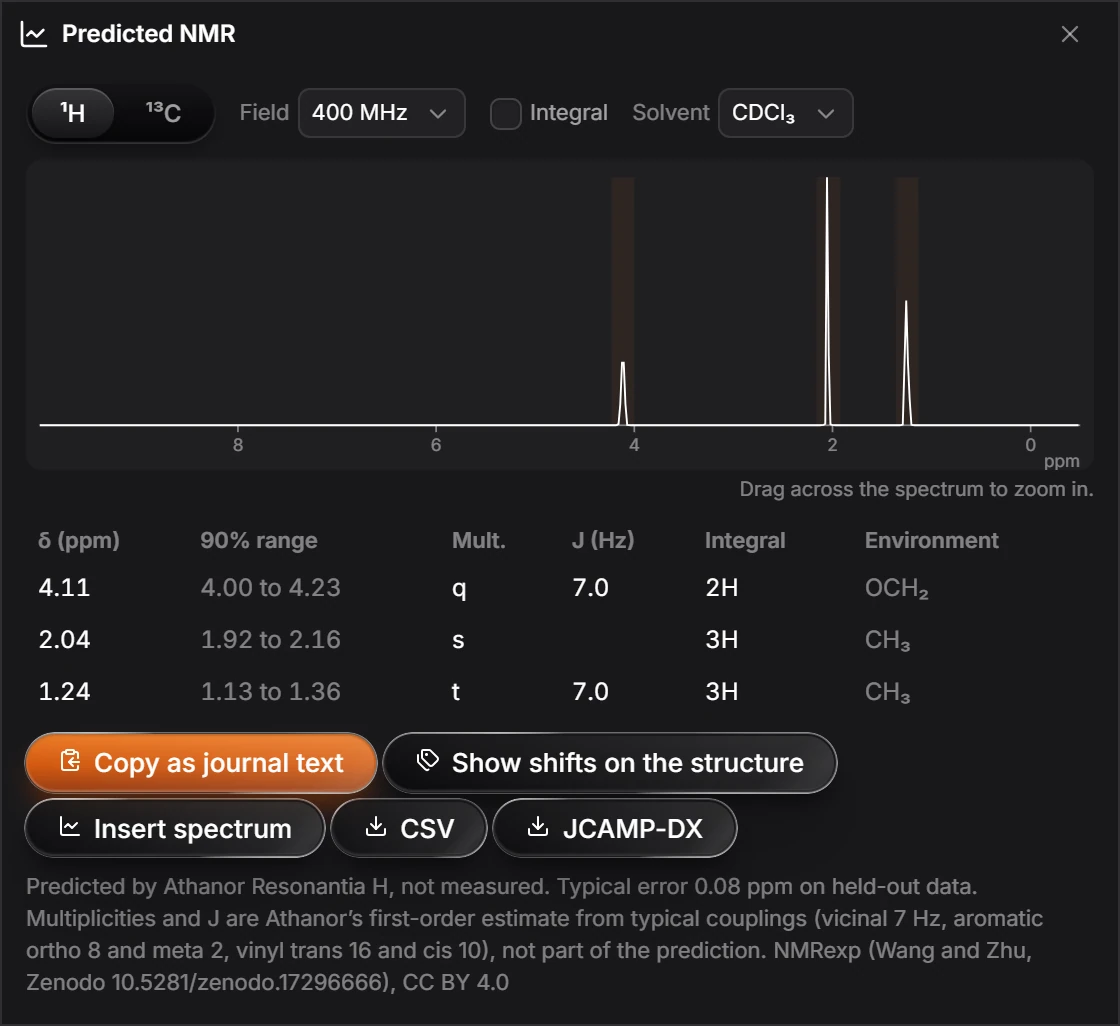
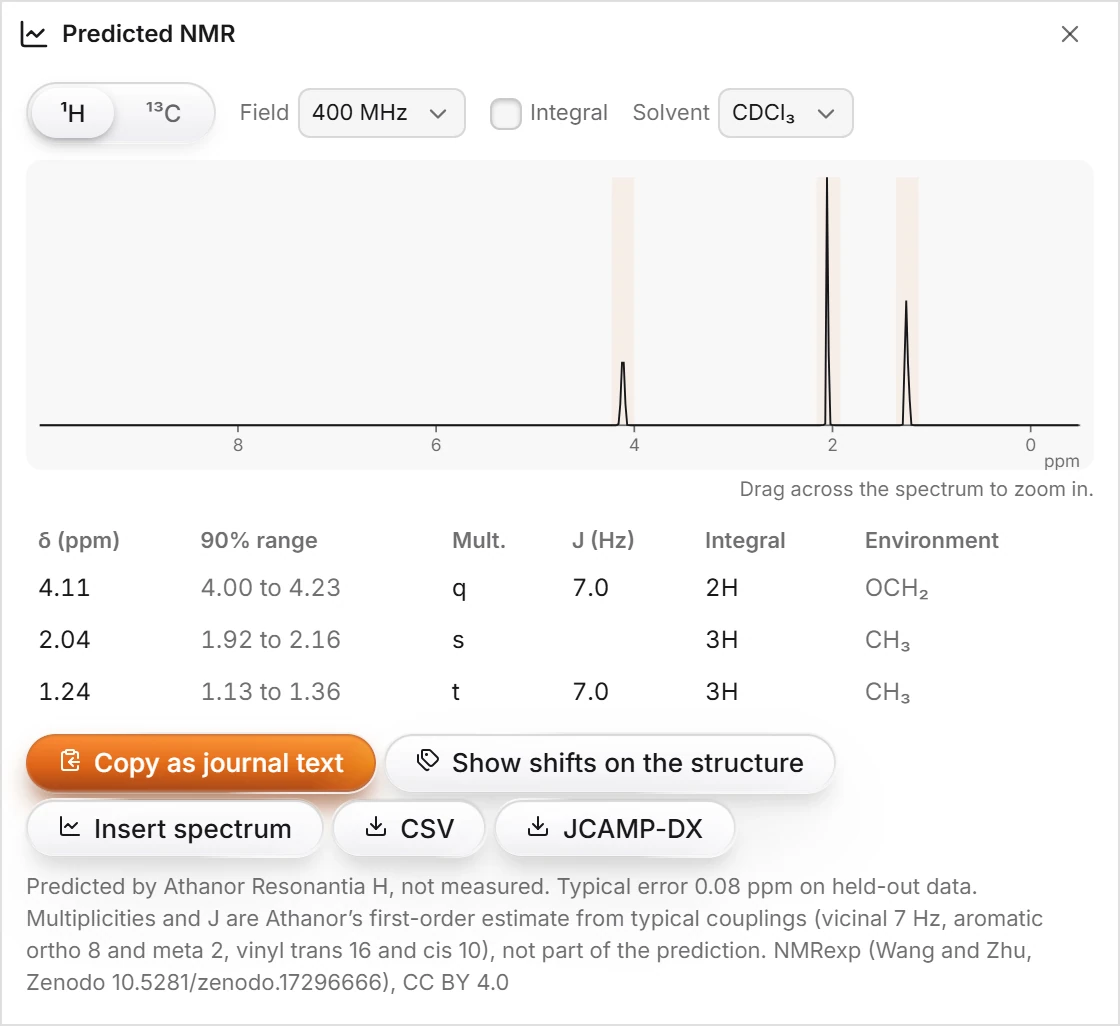
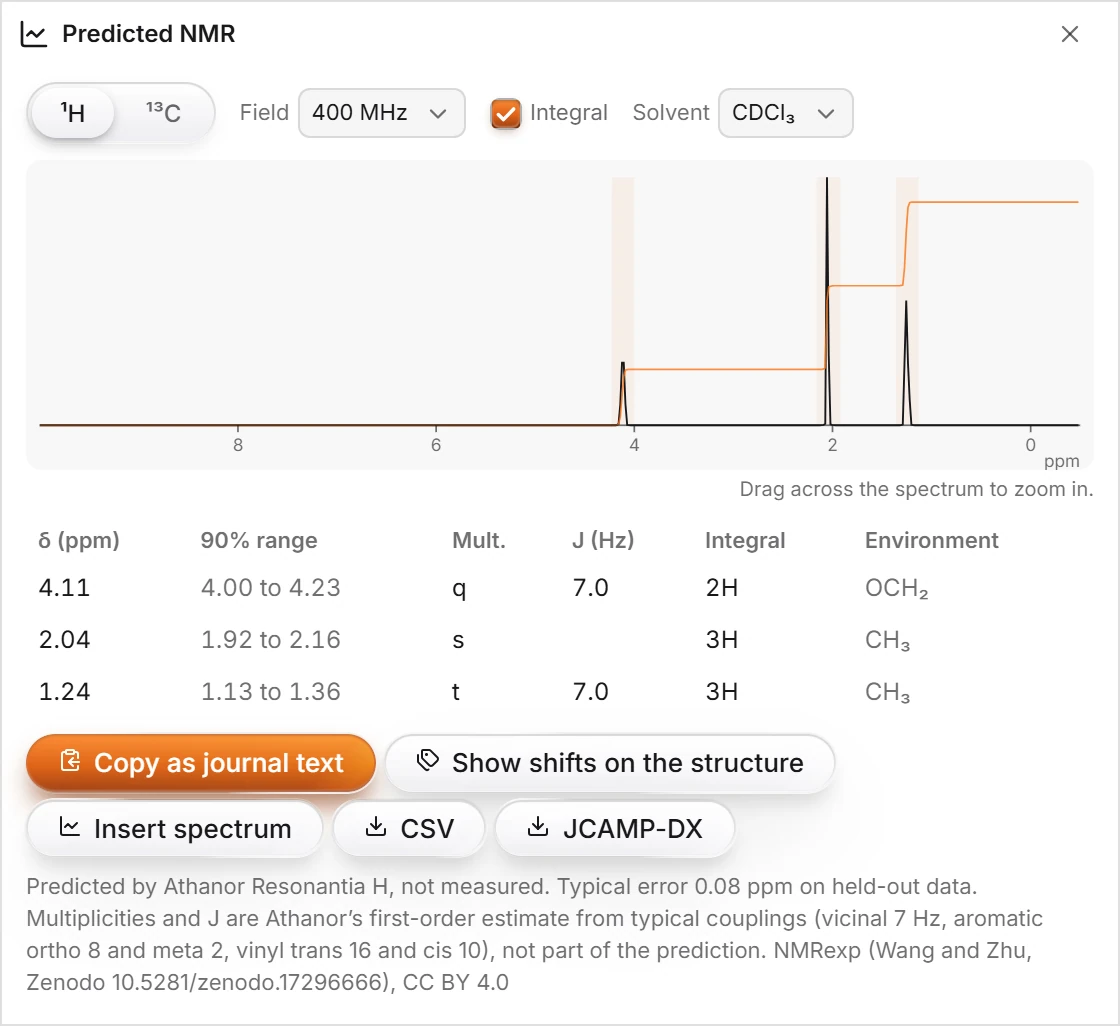
Tick Integral to draw the integral curve over the spectrum.

Prediction
These are predicted shifts, not measured ones, and the window says so in its note: predicted by Athanor Resonantia H, with a typical error of 0.08 ppm on held-out data. Multiplicities and J are first-order estimates from typical couplings, not part of the prediction. See How accurate predicted NMR shifts are.
Next
Is this helpful?
Last updated Nov 12, 2026
- Still stuck? Read the FAQ or contact support.
- Something wrong on this page? Tell us.
- For AI tools: llms.txt