
The NMR window
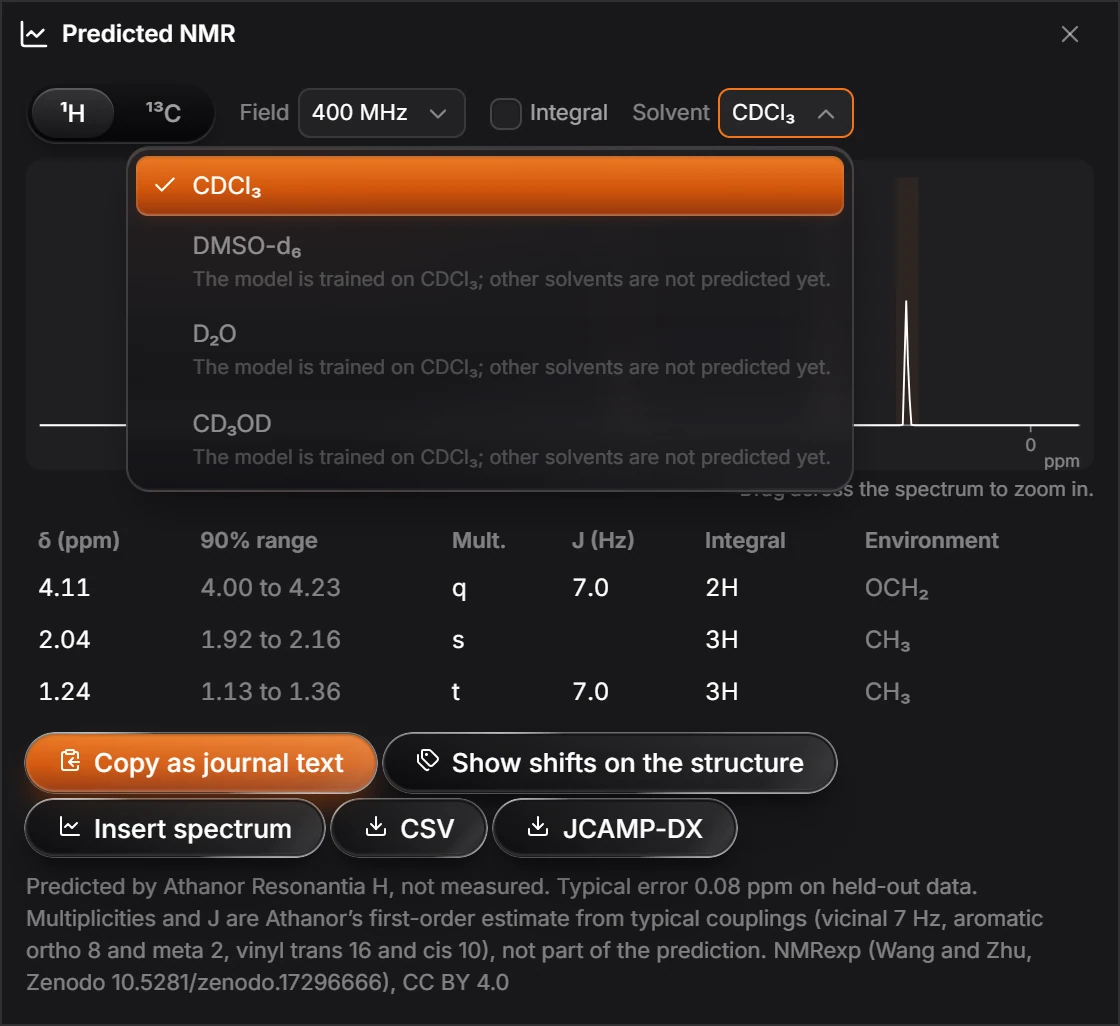
The Predicted NMR window opens from Object › Chemistry › Predict 1H NMR or Predict 13C NMR. It has 1H and 13C tabs, a Field and Solvent choice, an Integral switch, a spectrum you can zoom by dragging, the table of signals, and buttons to copy, label, insert or save.
Open it
Select a structure, then either:
- choose Object › Chemistry › Predict 1H NMR or Predict 13C NMR in the Main menu,
- right-click the structure and choose NMR, or
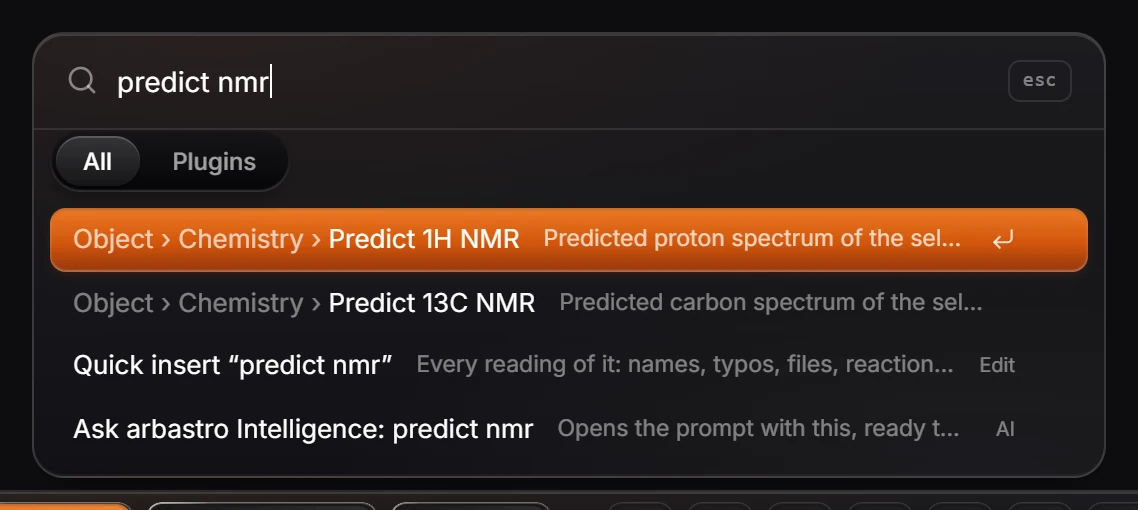
- press Ctrl+K, type
predict nmrand pick one.
The top row
- ¹H and ¹³C switch between the proton and carbon predictions.
- Field sets the spectrometer frequency for the drawing: 300, 400, 500 or 600 MHz for ¹H (101 MHz is shown for ¹³C at 400 MHz). It changes how close multiplets sit, not the shifts.
- Integral draws the integral curve.
- Solvent is CDCl₃. The other solvents in the list (DMSO-d₆, D₂O, CD₃OD) are not predicted yet: the model is trained on CDCl₃, and the list says so.
The spectrum
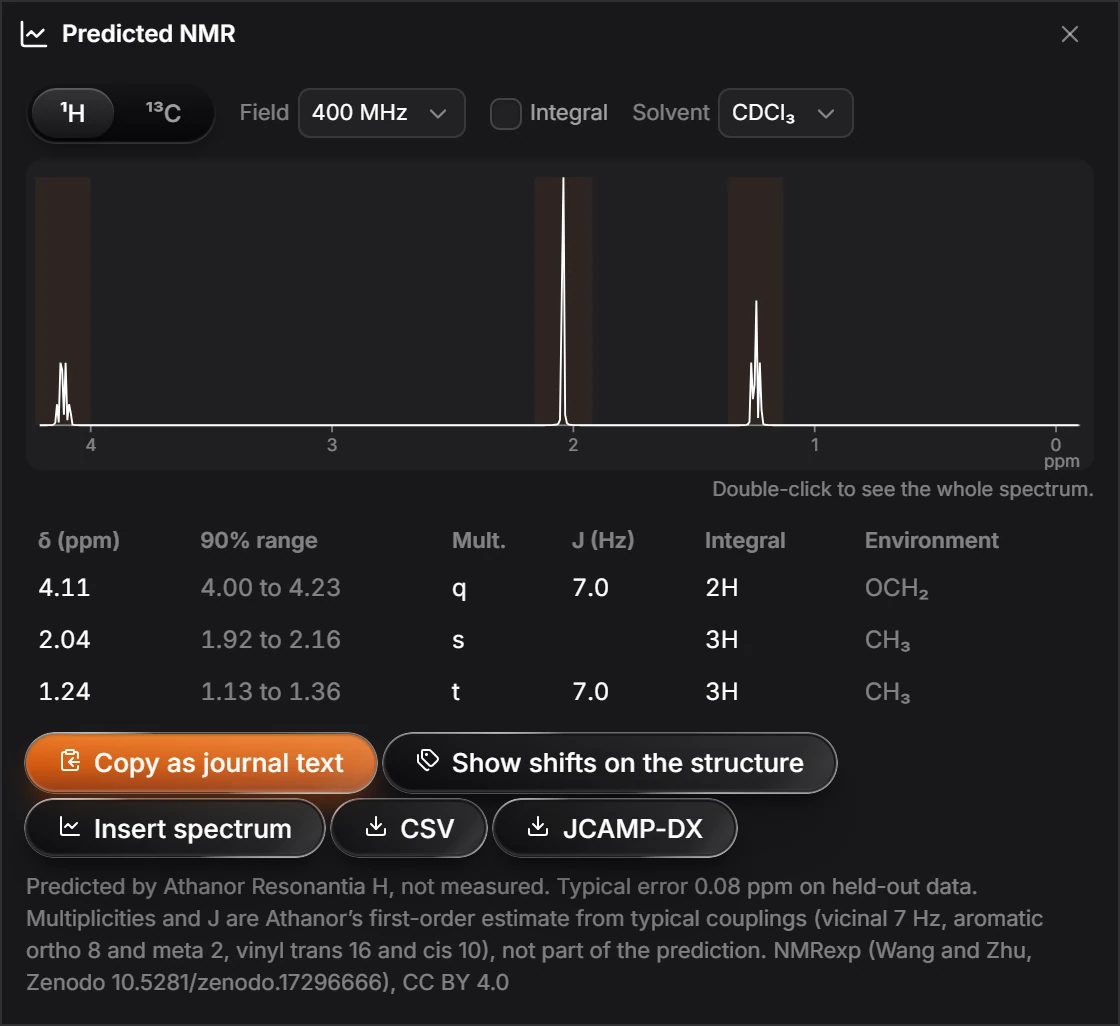
Drag across the spectrum to zoom into that range. Double-click to see the whole spectrum again.
The table
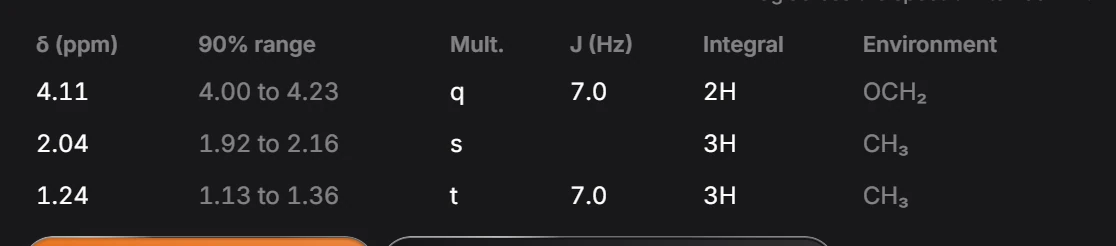
One row per signal. For ¹H: shift, 90% range, multiplicity, J, integral and environment. For ¹³C: shift, 90% range, type and environment.
The buttons
| Button | Does |
|---|---|
| Copy as journal text | Copies the data in the format journals use. See How to copy NMR data as journal text. |
| Show shifts on the structure | Writes each shift beside its atom. See How to label a structure with its chemical shifts. |
| Insert spectrum | Puts the spectrum on the page as a figure. |
| CSV | Saves the table as a CSV file. |
| JCAMP-DX | Saves the spectrum as a JCAMP-DX file, the standard exchange format for spectra. |
The note at the bottom says where the prediction comes from and how accurate it typically is.
Is this helpful?
Last updated Nov 12, 2026
- Still stuck? Read the FAQ or contact support.
- Something wrong on this page? Tell us.
- For AI tools: llms.txt