
How to add an energy diagram that follows the animation
In the Timeline, press the Energy diagram button. An energy profile appears on the canvas, with the steps along the bottom and a marker that follows the playhead as the animation plays.
Steps
Make an animation with at least two steps. See How to animate a reaction mechanism.
In the Timeline's bar, press Energy diagram. On a narrow window it moves into the bar's ⋯ (More) menu.
An energy profile appears in the corner of the canvas: the steps run along the bottom, with a peak at the transition state. A marker shows where the playhead is.
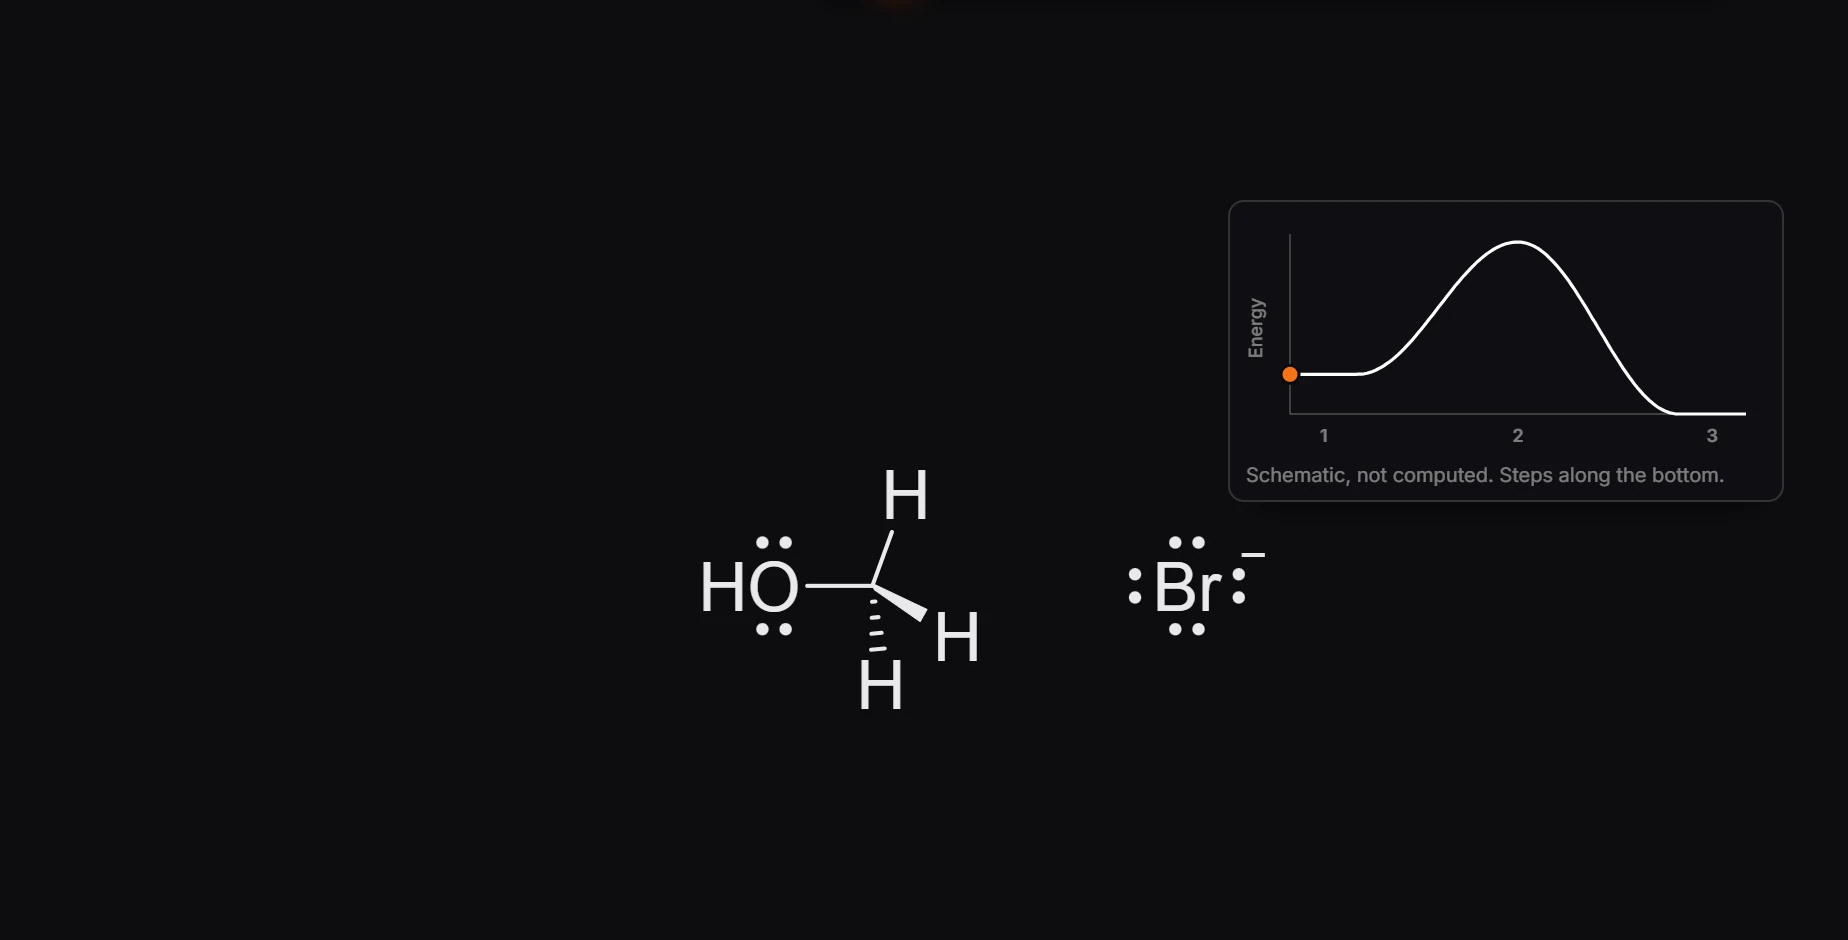
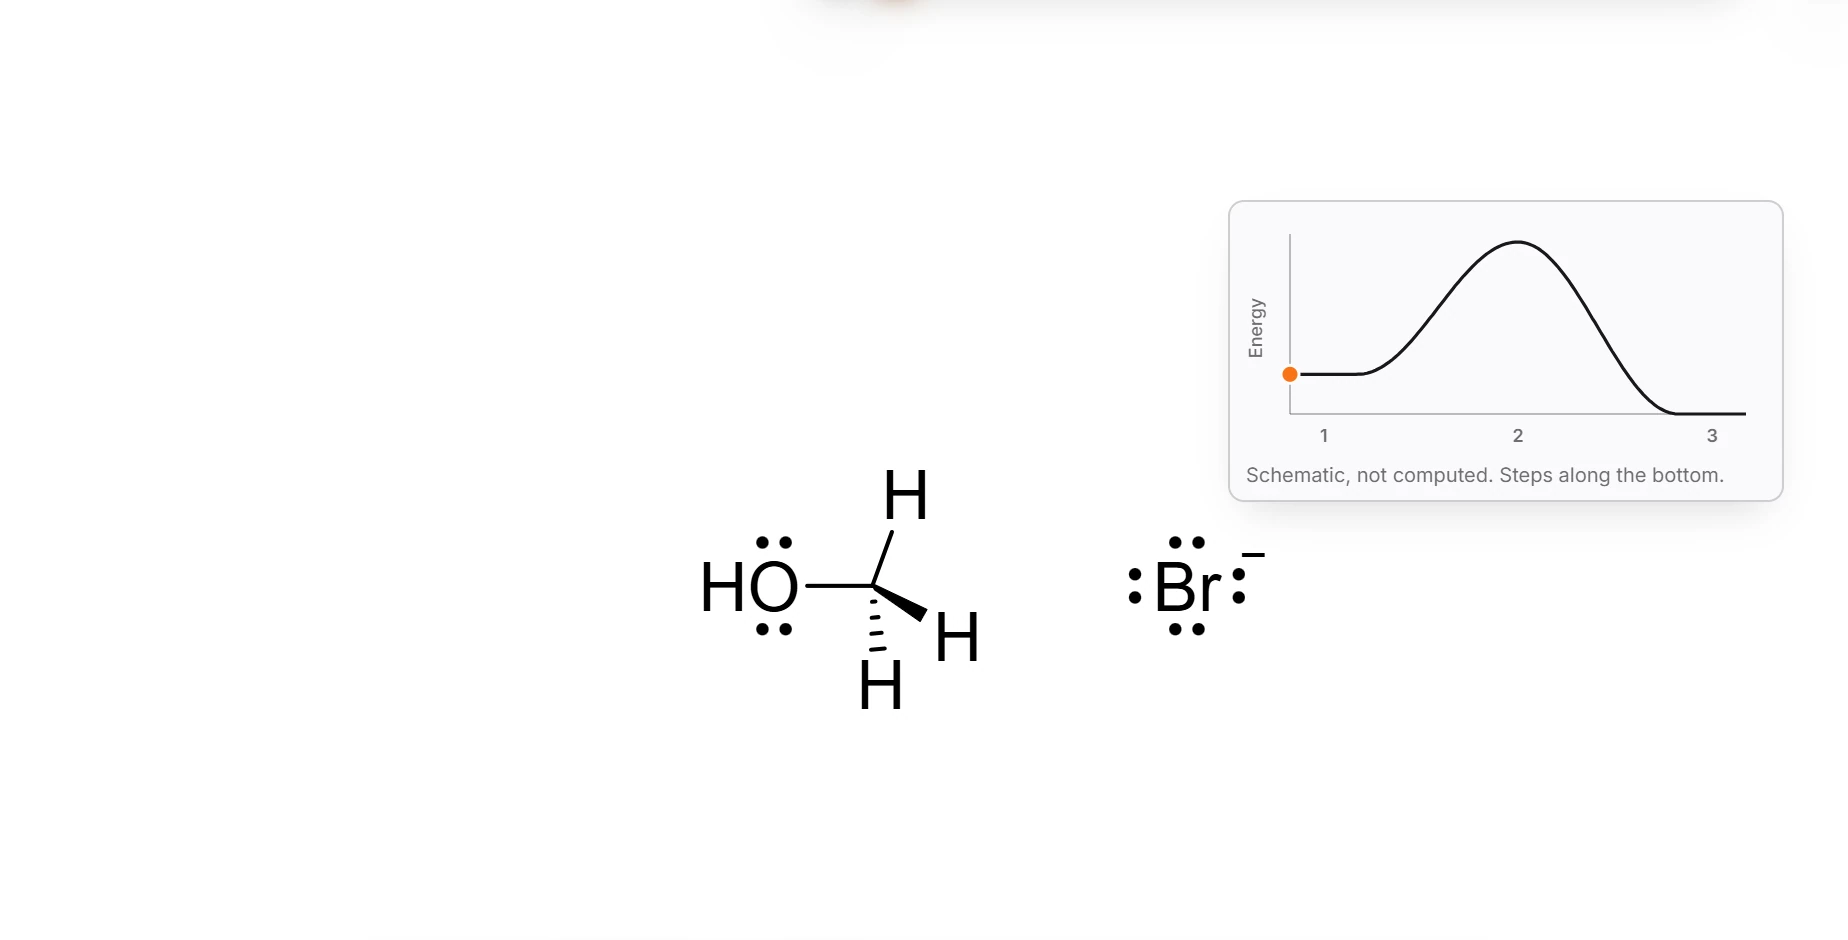
Press Play. The marker moves along the curve with the animation.
Press Energy diagram again to hide it.
Prediction
The curve is schematic, not computed: its label says so ("Schematic, not computed. Steps along the bottom."). It shows the shape of the reaction for teaching, not measured or calculated energies.
Is this helpful?
Last updated Nov 12, 2026
- Still stuck? Read the FAQ or contact support.
- Something wrong on this page? Tell us.
- For AI tools: llms.txt